
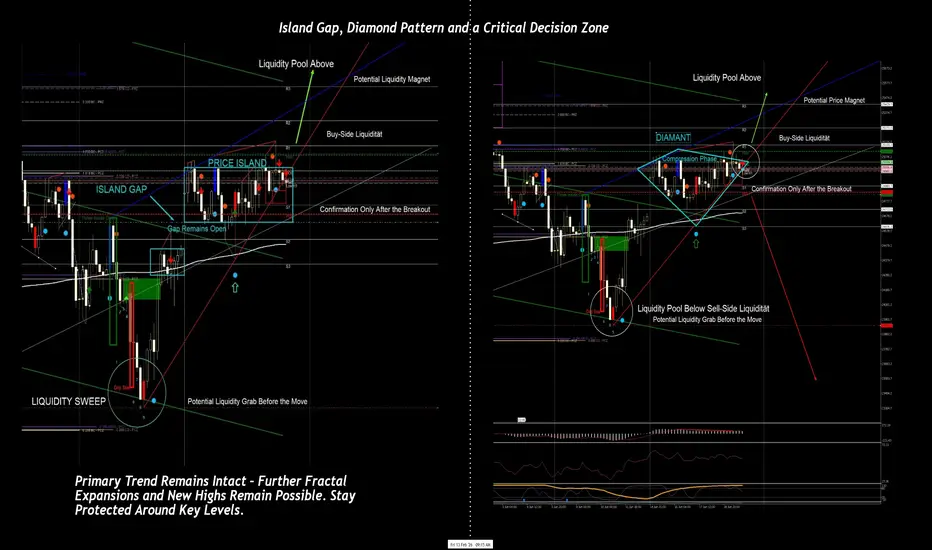
DAX40 – Island Gap and Diamond Pattern: Two Major Structures, One Decision
The current H4 chart can be interpreted in two very different ways, which is exactly what makes the current market structure so interesting.
On one side, we have a structure that could be viewed as a potential Diamond Pattern. On the other side, the market is still holding an open Island Gap, which continues to support a bullish market structure.
Both formations exist within the same price area, yet they tell two completely different stories.
From a technical perspective, the 24,822 zone remains the key level to watch.
A sustained break below 24,822 would significantly increase the probability of a larger trend reversal and strengthen the bearish Diamond Pattern scenario. In that case, the market could begin searching for liquidity at lower levels and challenge the current structure.
As long as buyers continue to defend this area, however, the Island Gap remains intact and the bullish scenario stays valid.
What makes this setup particularly interesting is that an open gap can sometimes act not only as a structural feature but also as an accelerator of future price movement. If support continues to hold and the market stabilizes above the key zones, another fractal expansion toward the upper liquidity areas could follow with significant momentum.
What makes this setup even more interesting is that these two formations are not necessarily mutually exclusive.
A breakout from the Diamond Pattern does not automatically invalidate the Island Gap scenario. In fact, a successful bullish breakout could reinforce the existing Island Gap structure and accelerate the move toward the upper liquidity zones.
This is one of the reasons why I continue to expect fast and dynamic price movements. Both formations are relatively large in scale, and larger structures often lead to larger reactions once the market commits to a direction.
Whether the market chooses continuation or reversal, the current structure suggests that volatility could increase significantly once the decision phase is complete.
At the moment, I continue to lean toward the bullish scenario.
As long as the 24,822 area remains defended, I believe the market still has the potential to produce further fractal expansions toward the higher liquidity zones.
The Island Gap remains open, the broader structure remains constructive, and a bullish breakout from the Diamond Pattern could act as an additional catalyst for momentum.
This does not mean the market must move higher immediately. Pullbacks and liquidity sweeps remain possible, particularly around the key support zones. However, as things currently stand, I continue to view the present structure as a potential continuation pattern rather than a confirmed reversal.
As always, the key levels will determine whether this view remains valid.
Therefore, the most important question is not which pattern is correct.
The real question is:
How will the market react at the key levels?
Below 24,822, the Diamond Pattern gains credibility.
Above 24,822, the Island Gap remains active and the probability of continuation toward the higher liquidity zones increases.
As is often the case, the pattern itself does not determine direction.
The market does.
**Liquidity first, direction second.**
# Diamond Pattern – The Psychology Behind the Structure
Many traders immediately view a Diamond Pattern as a potential reversal formation.
However, what interests me most is not the shape itself, but the psychology behind it.
A Diamond often develops when the market enters a phase of uncertainty. Volatility expands as buyers and sellers become increasingly aggressive. New highs are bought, pullbacks are sold, and both sides attempt to take control.
At first glance, this appears to be strength.
In reality, it often signals disagreement.
Market participants no longer agree on fair value.
As the structure develops, volatility begins to contract. Price compresses and the market enters a decision phase.
This is where many traders begin anticipating a breakout before it actually occurs.
From a liquidity perspective, these structures can become attractive because both sides of the market contain resting orders, stop-losses, and trapped traders.
For this reason, a Diamond Pattern is not bearish simply because it looks like a Diamond.
It only becomes bearish if the market confirms it.
Until then, both outcomes remain possible.
A breakout above the structure could force sellers to cover positions and drive price toward higher liquidity zones.
A breakdown below the structure could trigger long liquidations and accelerate downside momentum.
The pattern itself does not reveal the answer.
The reaction after the breakout does.
# Island Gap – When the Market Changes Its Mind
While the Diamond Pattern reflects uncertainty, an Island Gap often reflects a sudden shift in market conviction.
Before an Island Gap forms, market participants are usually focused on one direction. Sentiment becomes one-sided and expectations begin to align.
Then something changes.
The market suddenly refuses to trade at previous prices.
A gap is created and a section of price action becomes isolated from the prior move.
This isolated area becomes the "Island."
From a psychological perspective, the most important part of an Island Gap is not the gap itself.
It is the message behind it.
The market is effectively saying that the previous prices are no longer accepted.
Traders positioned on the wrong side of the move suddenly find themselves trapped. Every rally increases pressure on sellers. Every pullback attracts new buyers looking for confirmation.
As long as the gap remains open, buyers continue to demonstrate strength.
This is why many traders view an open Island Gap as a sign that market sentiment has shifted.
Of course, no pattern is perfect.
If the gap is closed and the structure begins to fail, the bullish argument weakens considerably.
Until then, the market continues to show a willingness to accept higher prices.
Sometimes a gap tells us more about market psychology than dozens of candles ever could.
The current H4 chart can be interpreted in two very different ways, which is exactly what makes the current market structure so interesting.
On one side, we have a structure that could be viewed as a potential Diamond Pattern. On the other side, the market is still holding an open Island Gap, which continues to support a bullish market structure.
Both formations exist within the same price area, yet they tell two completely different stories.
From a technical perspective, the 24,822 zone remains the key level to watch.
A sustained break below 24,822 would significantly increase the probability of a larger trend reversal and strengthen the bearish Diamond Pattern scenario. In that case, the market could begin searching for liquidity at lower levels and challenge the current structure.
As long as buyers continue to defend this area, however, the Island Gap remains intact and the bullish scenario stays valid.
What makes this setup particularly interesting is that an open gap can sometimes act not only as a structural feature but also as an accelerator of future price movement. If support continues to hold and the market stabilizes above the key zones, another fractal expansion toward the upper liquidity areas could follow with significant momentum.
What makes this setup even more interesting is that these two formations are not necessarily mutually exclusive.
A breakout from the Diamond Pattern does not automatically invalidate the Island Gap scenario. In fact, a successful bullish breakout could reinforce the existing Island Gap structure and accelerate the move toward the upper liquidity zones.
This is one of the reasons why I continue to expect fast and dynamic price movements. Both formations are relatively large in scale, and larger structures often lead to larger reactions once the market commits to a direction.
Whether the market chooses continuation or reversal, the current structure suggests that volatility could increase significantly once the decision phase is complete.
At the moment, I continue to lean toward the bullish scenario.
As long as the 24,822 area remains defended, I believe the market still has the potential to produce further fractal expansions toward the higher liquidity zones.
The Island Gap remains open, the broader structure remains constructive, and a bullish breakout from the Diamond Pattern could act as an additional catalyst for momentum.
This does not mean the market must move higher immediately. Pullbacks and liquidity sweeps remain possible, particularly around the key support zones. However, as things currently stand, I continue to view the present structure as a potential continuation pattern rather than a confirmed reversal.
As always, the key levels will determine whether this view remains valid.
Therefore, the most important question is not which pattern is correct.
The real question is:
How will the market react at the key levels?
Below 24,822, the Diamond Pattern gains credibility.
Above 24,822, the Island Gap remains active and the probability of continuation toward the higher liquidity zones increases.
As is often the case, the pattern itself does not determine direction.
The market does.
**Liquidity first, direction second.**
# Diamond Pattern – The Psychology Behind the Structure
Many traders immediately view a Diamond Pattern as a potential reversal formation.
However, what interests me most is not the shape itself, but the psychology behind it.
A Diamond often develops when the market enters a phase of uncertainty. Volatility expands as buyers and sellers become increasingly aggressive. New highs are bought, pullbacks are sold, and both sides attempt to take control.
At first glance, this appears to be strength.
In reality, it often signals disagreement.
Market participants no longer agree on fair value.
As the structure develops, volatility begins to contract. Price compresses and the market enters a decision phase.
This is where many traders begin anticipating a breakout before it actually occurs.
From a liquidity perspective, these structures can become attractive because both sides of the market contain resting orders, stop-losses, and trapped traders.
For this reason, a Diamond Pattern is not bearish simply because it looks like a Diamond.
It only becomes bearish if the market confirms it.
Until then, both outcomes remain possible.
A breakout above the structure could force sellers to cover positions and drive price toward higher liquidity zones.
A breakdown below the structure could trigger long liquidations and accelerate downside momentum.
The pattern itself does not reveal the answer.
The reaction after the breakout does.
# Island Gap – When the Market Changes Its Mind
While the Diamond Pattern reflects uncertainty, an Island Gap often reflects a sudden shift in market conviction.
Before an Island Gap forms, market participants are usually focused on one direction. Sentiment becomes one-sided and expectations begin to align.
Then something changes.
The market suddenly refuses to trade at previous prices.
A gap is created and a section of price action becomes isolated from the prior move.
This isolated area becomes the "Island."
From a psychological perspective, the most important part of an Island Gap is not the gap itself.
It is the message behind it.
The market is effectively saying that the previous prices are no longer accepted.
Traders positioned on the wrong side of the move suddenly find themselves trapped. Every rally increases pressure on sellers. Every pullback attracts new buyers looking for confirmation.
As long as the gap remains open, buyers continue to demonstrate strength.
This is why many traders view an open Island Gap as a sign that market sentiment has shifted.
Of course, no pattern is perfect.
If the gap is closed and the structure begins to fail, the bullish argument weakens considerably.
Until then, the market continues to show a willingness to accept higher prices.
Sometimes a gap tells us more about market psychology than dozens of candles ever could.
交易進行

註釋
Today's R3 is located almost exactly at 25,077. This level could act as resistance ahead of the upcoming data release, but if price manages to establish itself above this zone, buyers may quickly step back into the market.For that reason, I would be cautious with new short positions around this area. The reaction at 25,077 could provide important clues about the market's next directional move.
A sustained break above the zone would strengthen the bullish case and could open the door for further upside expansion toward the higher liquidity areas.
註釋
as long as buyers remain willing to defend higher prices, the broader market structure remains constructive.
However, we are currently trading right around 25,077, which coincides almost perfectly with today's R3. This places the market in an important decision zone and potential liquidity-sweep area. Depending on how price reacts, this level could act as resistance initially and later become support.
**Key levels for today:**
• R3: 25,077
• R2: 25,033
• PDH: 24,989
• R1: 24,984
• Pivot: 24,940
• PDC: 24,936
• PDL: 24,896
• S1: 24,891
• S2: 24,847
• S3: 24,798
Interestingly, today's S3 carries similar importance on the downside as R3 does on the upside. If the larger formations — the Diamond Pattern and the Island Gap — remain active and key levels begin to break, the market could produce very fast moves in either direction.
Technically, it would not surprise me to see one more liquidity sweep, stop run, or brief panic move before a larger expansion unfolds. For that reason, traders should not be shaken out by fast moves into these zones followed by equally fast reversals. Quite often, these are simply part of the process before the market commits to a direction.
We are currently trading inside an impulsive decision zone. Traders who are already positioned from lower levels have a clear advantage. Those entering near a potential breakout area should be aware that patience and strong nerves may be required.
Wishing everyone good trades and a successful trading week.
註釋
The R3 at 25,077 was tested this morning and, as mentioned earlier, price performed a small liquidity sweep into the lower support zones. From there, buyers stepped back in and pushed the market back toward 25,077 and beyond.The current pullback into the 25,045–25,077 zone is technically interesting. This area represents a key resistance zone on the lower timeframes. As long as price continues to hold above it and does not break back below, the zone may begin acting as support rather than resistance, opening the door toward the higher liquidity areas discussed previously.
In addition, today's R2 at 25,033 has developed into a significant bullish order block. The confluence between R2, the order block, and the former resistance zone adds technical importance to this area. As long as buyers continue to defend it, the bullish structure remains intact and further upside expansion remains possible.
Ideally, the lower timeframes should continue showing strong buying pressure and quick rejections of any move back below these levels. If that continues, the current structure may simply be preparing for the next expansion phase.
After many years of trading and screen time, one thing becomes increasingly clear: the definition of a pattern is often more important than the pattern itself.
The real question is not whether a Diamond, Head and Shoulders, or any other formation exists. The real question is where the liquidity sits, who is trapped, and where the market is most likely to go next.
Patterns are only visual representations.
Market behavior is what truly matters.
註釋
# DAX40 – Sustainable Breakout or Liquidity Trap? A Smart Money Perspective Around 24,822Many traders focus solely on whether a key level is broken. Smart Money, however, focuses on what happens after the breakout.
The **24,822** area remains a technically important level. While price briefly traded below it and reached the **24,730** region, the market failed to establish acceptance beneath the level. Instead, buyers stepped in aggressively and pushed price back above **24,900** within a short period of time.
This type of price action is often associated with a potential liquidity sweep.
## Was the Liquidity Sweep Already Completed?
Below 24,822, a significant amount of liquidity was likely resting in the form of stop-loss orders, forced exits from long positions, and newly opened short positions.
Institutional participants often target these areas because liquidity is required to execute larger orders efficiently.
The sharp recovery back into the previous trading range suggests that the market may have already collected the liquidity it was seeking below the level.
Quite often, the market creates the impression of a major bearish breakdown, attracting additional sellers and triggering stops, only to reverse once sufficient liquidity has been gathered.
## How To Identify A Sustainable Bullish Breakout
A genuine breakout is usually supported by several confirmations:
* Strong closes above 24,822
* Higher highs and higher lows
* Successful retests of the breakout zone
* Consistent bullish momentum
* Quick buying responses on pullbacks
* Clear liquidity targets above current price
The most important factor is acceptance above the level. A breakout alone is not enough.
## How To Identify A Fake Breakout
A fake breakout often follows a different sequence:
* A fast move beyond a key level
* Liquidity and stop orders are collected
* Immediate rejection follows
* Price returns into the previous range
* Lack of follow-through momentum
* Market reverses in the opposite direction
Smart Money is less interested in whether a level is briefly broken and more interested in whether the market can remain above or below that level.
## The Importance of 25,070
Another important detail is the behavior around the **25,070** zone.
The market has now attempted several times to establish this area as support, yet each attempt has failed to hold sustainably. Today's selling pressure once again pushed price away from the region, confirming that sellers remain active there.
However, from a Smart Money perspective, repeated tests of the same resistance zone are often worth monitoring closely. Every rejection consumes available sell-side liquidity. Over time, a level that repeatedly attracts sellers can become increasingly vulnerable to a breakout.
At some point, continuously shorting the same zone becomes less attractive from a risk-reward perspective. The more often a level is tested, the greater the risk that liquidity above it eventually becomes the next target.
This is especially relevant because the 25,070 area continues to attract a large number of scalpers and short-term traders looking for quick reversals. Such crowded positioning can create a dangerous environment, particularly if the market suddenly finds enough momentum to break through the zone.
For now, the rejection remains valid. However, the next test of 25,070 could become increasingly important. A successful break and acceptance above the level would likely force many short-term sellers to reconsider their positions.
## The Current Situation
What makes the recent move particularly interesting is that the decline below 24,822 failed to generate sustained downside momentum.
Instead, the move was almost completely bought back.
This behavior is consistent with the idea of a potential liquidity sweep and stands in contrast to several bearish technical signals that remain visible across lower timeframes. Among them are the previously discussed **Diamond Formation**, as well as other short-side setups that continue to attract attention.
As a result, the market currently appears to be at a critical decision point.
## Our Current View
Despite today's selling pressure, we continue to hold our long positions and remain focused on the broader structure rather than short-term market noise.
The key area remains **25,070**. If the market approaches this zone again, it will be important to observe whether sellers can defend it once more or whether buyers finally manage to establish acceptance above it.
At the same time, the **24,790** region remains an important support reference within the current structure and will continue to be monitored closely during any pullbacks.
As always, confirmation is more important than prediction.
## Final Thoughts
The key question is not whether 24,822 was briefly broken.
The real question is whether sellers still maintain control after the sweep.
If the market can establish acceptance above 24,822 and continue building higher lows, the probability increases that the liquidity below has already been cleared and that higher liquidity pools may become the next objective.
However, if buyers fail to maintain control and the current highs cannot be broken decisively, the bearish structures remain valid.
The coming sessions should reveal whether the move toward 24,730 was simply a liquidity hunt or the beginning of a larger move toward lower support zones.
As always, let the market provide confirmation before committing to a directional bias.
**Trade safe and have a great trading week ahead.**
註釋
**DAX40 Update**The DAX is once again trading around the lower support zone at **24,822**.
The next 15-minute candle will be important. If price fails to reclaim this level and closes below 24,822, the probability of further downside increases and our **24,600 zone** could come back into play.
It is worth noting that the 1-minute chart currently shows several small bullish reversal attempts forming around this area. If the market quickly breaks below the **Previous Day Low (PDL)**, many of these early bullish setups could be trapped and forced out of the market, potentially adding further downside momentum through stop-loss liquidation.
Should weakness continue, we would consider activating a **protective hedge below today's S1 at 24,715**, with our planned hedge entry around **24,695**. The hedge would represent approximately half of our position and would serve purely as protection rather than a profit-taking trade. As soon as market conditions allow, the stop-loss on the hedge would be moved to break-even.
The key level to watch on the upside is the **24,904 Pivot**. A quick recovery back above this level would be an encouraging sign for buyers and could shift momentum back to the upside. If the market manages to reclaim and hold above the Pivot, the current move may ultimately prove to be nothing more than a liquidity sweep designed to clear out weak hands before the next advance.
For now, the focus remains on the reaction around the PDL and the behaviour of the next 15-minute candles. A fast recovery would favour the bullish scenario, while continued acceptance below support would increase the probability of a deeper move into the lower liquidity zones before the next meaningful rebound develops.
Trade safe.
註釋
If the market triggers our hedge entry at **24,695** and then starts moving back higher, we will place the hedge stop-loss at **24,830** to further reduce risk.The lower long position from **24,172** remains active and is still protected at **break-even**. In addition, the position is secured with a dynamic **ATR-based stop-loss**.
Depending on how the chart develops, I may remove the ATR stop on the 24,172 position and allow the hedge to continue running. In that case, the focus would shift toward a potential move back into the **formation base**, should the market structure confirm a deeper correction.
註釋
At today's **S3 at 24,347**, I will likely close the short hedge. This would give the long position more room toward the formation base, while also allowing the hedge to offset a large part of the protection costs incurred so far.Should the market move down to **24,600**, the hedge will be moved to **break-even**. For now, the hedge stop-loss remains at **24,830**.
The reaction around today's **S2** will be particularly interesting. The chart will show whether buyers are willing to defend this zone or if the market still wants to search for deeper liquidity before the next meaningful rebound.
Our overall view remains unchanged: we stay **long the market**, while the hedge serves purely as protection. If price reaches **24,172**, the situation will be reassessed based on the market structure and price action at that time.
註釋
### DAX40 Hedge UpdateWe plan to close our short hedge around the **24,560** area.
From our technical perspective, this zone could activate a potential **AB=CD pattern**, which may provide the foundation for a rebound toward today's Pivot at **24,904**.
In addition, today's **S2** is located within the same region, creating an area of technical confluence that deserves close attention. For this reason, our focus remains firmly on the market's reaction around the S2 zone.
At the moment, the stop-loss on the short hedge has already been moved slightly below break-even, allowing us to further reduce risk while maintaining downside protection.
Should the market continue lower, additional hedge protection would only be considered below **24,473**, where a deeper liquidity search and a possible expansion toward lower support zones could develop.
For now, the key question is whether buyers are willing to defend the confluence between the AB=CD completion zone and today's S2. The reaction there could provide valuable clues regarding the next directional move.
As always, we let price action confirm the scenario before making further adjustments.
註釋
### DAX40 – Hedge UpdateAfter two separate pullbacks, the market was unable to trigger our hedge stop-loss around **24,695 / 24,694.5**. Despite several attempts, sellers failed to push price high enough to remove the protection.
As a result, the market never reached our originally anticipated **AB=CD completion zone around 24,560–24,580**.
With downside momentum fading and buyers continuing to defend the structure, we decided to close the short hedge around **24,694.3** for a small profit. The profit itself was not important. The hedge had already fulfilled its purpose by protecting the portfolio during the corrective phase without forcing any change to our broader market outlook.
With the hedge now removed, we are once again fully positioned with our **two long positions**.
From a technical perspective, it is particularly interesting that the market failed to reach the lower support and AB=CD completion zone. When a market repeatedly fails to achieve a lower target despite several attempts, it often suggests that sellers are losing momentum while buyers begin absorbing available supply.
Nevertheless, the area between **24,560 and 24,715 (S1)** remains highly relevant. This zone could continue attracting buyers and may serve as an important support region within the current structure. The potential **AB=CD pattern** also remains on our radar. Should momentum return above S1 and buyers maintain control, the pattern could still play a role in supporting a move back toward today's Pivot level.
As mentioned in previous updates, we remain prepared for the possibility of a deeper liquidity search. A new protective hedge order has been placed around **24,473** and would only be activated if the current support structure begins to fail in a more meaningful way.
For now, our focus shifts back toward the upside. The key question is whether buyers can continue building momentum and rotate price back toward today's **Pivot level at 24,904** and eventually toward the higher liquidity zones discussed in previous analyses.
As always, we remain focused on market structure, liquidity, and confirmation rather than prediction.
**Trade safe and have a successful trading session.**
註釋
# DAX40 – The Diamond Still ShinesA diamond attracts attention because it shines. The current market structure is no different.
Within this formation, there is something for everyone: **scalpers, day traders, swing traders, gap traders, and range traders**. Every group sees an opportunity, which is exactly why volatility has increased so dramatically. Hope for longs, hope for shorts... back and forth until many traders are left with empty pockets.
This is why caution is essential. Don't let greed dictate your decisions.
As mentioned yesterday, the market has once again returned to the **old Pivot**, the same area where many traders were already caught on the wrong side of the move. From a broader technical perspective, the current Diamond formation still allows for aggressive liquidity sweeps and strong momentum spikes before revealing its true direction.
Many people believe trading means placing an order in the morning and closing it with an easy profit in the evening. In reality, consistently successful trading requires preparation, experience, continuous risk management, and the ability to adapt to changing market conditions. Especially during market phases like this, where price behaves like a psychological ping-pong match, emotions become the biggest enemy.
---
## Key levels for today
The **old Pivot at 24,904** remains one of today's most important reference levels.
Today's **Pivot at 24,765** deserves special attention, as it also aligns with the **38.2% Fibonacci retracement** of the active **AB=CD pattern**. At the moment, price is trading around the **61.8% Fibonacci retracement**.
From a technical perspective, a pullback toward the **38.2% Fibonacci level (24,765)** would be perfectly healthy before buyers attempt another push higher. Such a retracement would allow the market to build a stronger base and confirm today's Pivot as new support rather than resistance.
If buyers successfully defend this level, the next objective would be a move back toward the **old Pivot at 24,904**. A break above that level could quickly accelerate the move toward the **25,033–25,070** target zone, which remains the primary objective of the active **AB=CD pattern**.
Should today's Pivot fail, attention shifts to **S1 at 24,558**, followed by **S2 at 24,380** and finally **S3 at 24,173**. These areas may become the next liquidity zones where buyers attempt to regain control.
Our hedge strategy remains exactly as described in the previous update.
If momentum returns, a break above the **Previous Day High (PDH) at 24,972** could quickly accelerate the move toward the **25,150–25,177** region. This area will be particularly interesting, as it will reveal whether **R2** becomes a new support level or continues to act as resistance. Possible momentum spikes toward **R3** should also remain on the radar.
As mentioned before, Diamond formations often challenge both sides of the market several times before the real directional move unfolds. Four, six, or even eight false moves are not unusual. This is classic DAX behaviour: traders often watch profitable positions turn into losses because they become emotionally attached to one direction instead of following the market structure.
Our overall strategy remains unchanged. We stay **long the market** while remaining **protected through our hedge**. The chart will decide which scenario ultimately prevails.
**Trade the structure, not the emotions.**
註釋

註釋
My positions, hedge strategy, target zones, and overall risk management have already been explained in the previous updates.Since this idea has gradually evolved into a live trading journal, I'll reduce the number of updates from here on and only post again when there is a meaningful change in the market structure or my trading plan.
Many people only look at the completed chart after the move has finished. What interests me most, however, is the journey that gets us there. That is where the real decisions are made—where positions are protected, hedges are opened or closed, and risk is continuously managed. In my opinion, this process is often far more valuable than simply looking at the final result.
If you would like me to continue sharing my daily market view and thought process, feel free to leave a short comment below. That will let me know there is genuine interest in these regular updates.
Otherwise, the trading plan remains unchanged.
I wish you all successful trading—and above all, the patience to stay committed to your plan.
註釋
Hello Deejay028, if you're reading this: as mentioned yesterday, price has now reached the 0.386 Fibonacci retracement of the pattern around 24,760. The AB=CD structure has been completed almost perfectly from a technical perspective, making this pullback a healthy correction rather than a change in trend.This is a region where buyers could begin stepping back into the market, and a technical rebound would increase the probability of price moving back toward the upper targets. The 25,110 area should come back into focus relatively quickly, with today's R1 around 25,128 providing the next important resistance zone.
That said, traders should still expect some fast liquidity spikes, potentially extending slightly below today's PDL at 24,681, before the market establishes a stronger directional move. The first key objective for buyers is today's Pivot at 24,905. As long as this level is reclaimed, the technical outlook continues to favor a recovery toward the higher resistance zones.
註釋
# DAX40 – Market UpdateAs mentioned yesterday, the DAX has completed the **AB=CD pattern** almost perfectly from a technical perspective and has since performed a healthy correction toward the **0.386 Fibonacci retracement** of the pattern. This pullback is considered a normal technical correction and, for now, confirms the underlying market structure.
The focus now shifts to the **key zone between today's Pivot at 24,905 and the PDC at 24,943**. If the market manages to reclaim this area during the morning or early afternoon and establish it as support, the probability increases significantly that the DAX will move one level higher today.
From a technical perspective, this would further confirm the **Island Gap** scenario. At the same time, it increases the risk for traders holding short positions into the weekend. It is not uncommon for major resistance levels that remain untouched during the trading week to be skipped by a weekend gap, leaving many short traders trapped and forced to cover their positions.
Nevertheless, traders should continue to expect sharp moves in the upper price regions. This is exactly where many short-term traders and scalpers are likely to initiate fresh short positions. If buying pressure continues to build, those positions could fuel additional **short covering**, accelerating the move even further.
The next resistance levels are relatively far apart, with **R1 at 25,128, R2 at 25,313, and R3 at 25,536**. If bullish momentum continues, fast Friday moves into these higher liquidity zones are certainly possible. Such a move could trigger additional stop orders and further accelerate the upside.
Below today's **S1 at 24,719**, however, caution is advised. Fast liquidity sweeps with aggressive selling pressure could extend briefly toward **24,675**. Should this level fail to hold, the next important rebound area comes into focus around **24,496**, which also represents our planned hedge zone.
A sustained break below this support could quickly extend the decline toward the **24,311** region. Such a move would likely surprise many market participants. At the same time, this area could attract larger buyers again and provide the foundation for a technical rebound back toward the key resistance levels.
Today's focus is not simply whether price reaches the Pivot/PDC zone, but **how the market reacts there**. If the area between **24,905 and 24,943** is reclaimed and successfully accepted as support, the bullish scenario remains intact and the probability of continuation toward the higher resistance levels increases significantly.
As today is Friday, traders should also expect increased volatility. Profit-taking, position adjustments ahead of the weekend, and liquidity sweeps can produce fast moves in both directions. The key will be whether buyers continue to provide **strong momentum and follow-through buying**. A slow advance without convincing buying pressure would increase the probability of another sweep into the lower support zones.
**Only a sustained break below 24,675 would significantly weaken the current bullish scenario and increase the probability of a move toward 24,496 and our hedge zone. Until then, pullbacks should be viewed as healthy corrections within the existing bullish market structure.**
Thank you for following my analysis.
**If you have any questions or observations, feel free to leave a comment.**
I wish everyone successful trading, disciplined risk management, and a relaxing weekend.
**See you next week!**
註釋
Here you'll find discussions about market structure, liquidity, sweeps, hedging, and my personal view of the DAX.I don't just explain where I believe the market might go. More importantly, I explain **why** I enter, hedge, manage, or close specific positions.
If your goal is to learn how to develop your own trading plan and execute it with discipline, you're in the right place.
If, on the other hand, your goal is to learn how to gain followers as quickly as possible... you might be better off studying the bright white charts with a single trendline and the headline, *"Market goes up."* 😉
And when a few large accounts with 10,000 or 20,000 followers start congratulating and promoting each other, you'll also understand how social media works.
The market, however, couldn't care less.
註釋
# DAX40 – Good Morning, Weekly Market UpdateGood morning everyone.
From a technical perspective, not much has changed since our last update.
**Our swing positions remain unchanged, and we continue to maintain our overall bullish bias.**
Our core long positions are still active, and we will continue managing the market exactly as previously discussed. The hedge around **24,600** also remains in place as part of our overall risk management.
As always, I prefer to **manage positions rather than chase every intraday move.**
Today's first important level is **24,822**, which aligns with today's **R3**. At the same time, price is currently trading above today's **Pivot at 24,728**. As long as the market remains above the Pivot, the short-term technical structure continues to favor stabilization.
Today's pivot levels are:
* **R1:** 24,759
* **R2:** 24,798
* **R3:** 24,822
* **Pivot:** 24,728
* **S1:** 24,690
* **S2:** 24,658
* **S3:** 24,620
The cluster between **R2 and R3** creates an important technical resistance zone. This area also aligns closely with the **0.618 Fibonacci retracement** of the current harmonic structure.
A temporary rejection from this region back toward **S1 (24,690)**, or even slightly below toward the Pivot, would remain technically healthy and could simply represent another liquidity sweep designed to collect newly placed stop-loss orders before buyers regain control.
However, **if buyers manage to establish acceptance above R3**, the technical picture improves significantly. Above **24,822**, the market has relatively little overhead resistance, opening the door toward the current **Three Drives completion target** and eventually our higher swing objectives.
Today's **S3** is located around **24,620**.
With several economic releases scheduled today, increased volatility should be expected.
A fast liquidity sweep below S3 would not surprise me. Such a move could quickly trigger stops beneath support before reversing back above R3. Technically, this scenario would fit very well with the current market structure and the developing **Three Drives harmonic pattern**, completing near the **0.000 Fibonacci projection around 24,545**.
However, if the market fails to reclaim this area after the initial sweep and instead breaks decisively below **24,545**, the current harmonic structure would likely extend toward the previously discussed **24,420** region. Ironically, a deeper completion of the pattern could increase the probability of an even stronger technical rebound afterward.
For exactly this reason, we deliberately decided **not** to place an additional hedge inside this lower zone.
As explained previously, this area often becomes a **trap zone**, where traders hedge too late, freeze profitable positions, and lose the flexibility to react when the market reverses. In fast-moving conditions, active trade management is usually far more effective than adding unnecessary hedges.
Fast moves during economic releases often trigger emotional decisions.
Many traders mistake volatility for a change in market structure.
Very often, it is simply liquidity being collected before the market reveals its true direction.
The bigger technical picture remains unchanged.
Our higher upside objectives around **25,118** and beyond continue to remain valid as long as the broader market structure stays intact.
Don't let fast intraday moves immediately change your market bias.
The financial media will always have a story ready.
One hour it's recession.
The next hour it's the automotive industry.
Then it's interest rates.
The market doesn't trade headlines.
**The market trades liquidity.**
Stay patient.
Stay objective.
Trade your plan.
Let price confirm the next move.
註釋
## DAX40 – Market UpdateBefore going any further, one important note:
**The key levels discussed in yesterday's analysis remain unchanged.** From a technical perspective, nothing significant has changed. If anyone would like today's updated pivot levels, feel free to leave a comment. However, yesterday's major technical zones remain just as relevant.
The liquidity sweep into the base of the **Three Drive** formation remains active, making the **25,120–25,177** region one of the most important areas to monitor over the coming sessions.
One interesting aspect I'm currently watching is the growing comparison between the DAX and the S&P 500.
Many market participants now assume that the DAX must automatically follow a potential correction in the US market. This is exactly the assumption I remain cautious about.
From a technical perspective, it is **not** the S&P 500 that determines the next move in the DAX, but the DAX's own market structure.
History has shown several periods where both indices temporarily decoupled, each following its own cycle for weeks or even months before reconnecting.
This is why my focus remains entirely on the DAX itself.
The key question is simple:
**Can buyers complete the current bullish cycle within the expected time window?**
A healthy impulsive cycle should continue progressing from one sequential level to the next. These sequential levels are built through market structure, momentum, volume, wave development and technical confluence. When a market fails to reach the next key level within the expected timeframe, it is often one of the earliest signs that the underlying structure is weakening and the probability of a larger trend transition begins to increase.
For now, **24,822** remains the key decision area. As long as buyers continue defending the structure and complete the move toward the **25,230–25,390** target zone within the expected timeframe, the current bullish scenario remains technically valid.
The coming trading sessions could therefore become decisive. Whether the market confirms or rejects the current cycle, volatility and momentum are likely to increase significantly.
Periods like these often catch traders on the wrong side of the market. For that reason, disciplined risk management and proper hedging remain far more important than simply being bullish or bearish.
This analysis will also influence my own trading decisions.
Depending on how the market reacts around these key levels during the remainder of the week, I will decide whether to realize the current profits in full or leave part of the position open for a potential continuation toward the **25,720** region.
As always, that decision will not be based on expectations, but on what the market structure confirms.
**The market decides — not our expectations.**
註釋
On the 3-hour chart, the Three Drive pattern continues to develop very cleanly from a technical perspective and remains well aligned with the ongoing TD Sequential count.At the moment, we are printing TD candle 7 of a possible 13, with approximately 2 hours and 30 minutes remaining before this candle closes. If the current sequence continues, the next candle will become TD 8, gradually moving the setup closer to a potential exhaustion phase.
Price is currently trading below today's R3 (25,069). As mentioned in yesterday's update, the ideal completion zone for the Three Drive pattern remains around 24,119.
If the market were to complete only the Three Drive pattern, a relatively quick move back toward the 24,822 region would be technically healthy. This area coincides with the Fibonacci retracement bands of the pattern and would represent a normal corrective move within the current bullish structure.
However, if the ongoing TD Sequential continues to support higher prices, the market may only retrace toward today's R2 (24,932). From a technical perspective, this level could once again attract buyers and potentially become a new support base for the next expansion toward the higher liquidity targets.
If today's R2 (24,932) fails to hold, the technical structure would favor another move toward 24,696. This remains an important support zone where buyers could step back in and defend the broader bullish structure.
As always, don't focus solely on the exact price levels. Pay close attention to how the market reacts within these zones. The reaction itself will provide the strongest confirmation of the next move.
註釋
If you draw a trendline connecting the last two swing highs on the 3-hour chart, you can clearly see how several technical factors are currently aligning.The trendline itself, the Three Drive pattern, the attraction toward the pattern target at 25,118, and the ongoing TD Sequential count (currently candle 7) are all pointing in the same direction.
From a purely technical perspective, today's R2 (24,932) should ideally continue to hold for the remainder of the current 3-hour candle if this bullish scenario remains intact.
With the next 3-hour candle, the market should then attempt to attack today's R3 and ideally extend toward the Three Drive target around 25,118, potentially with a final liquidity spike.
After reaching the target, price could quickly retrace back toward today's R3, which also represents an important historical key level. From a technical perspective, this would be a healthy development, provided the market can hold above that zone with the following candles.
Such price behaviour would keep the overall market structure healthy while maintaining the alignment between price, time, and the TD Sequential progression.
On the lower timeframes, quick spikes toward 24,822 remain possible. However, as long as those moves are rejected quickly and the candle bodies and trading volume continue to close above this key level, the overall bullish structure remains technically intact.
This is the technical scenario I will be watching closely as today's session develops.
註釋
This is a great example of why it's so important to combine multiple timeframes rather than focusing on just one.On the 1-minute chart, the situation briefly looked very bearish. However, during the final 10 minutes of the 3-hour candle, buyers stepped back in with increasing volume and pushed the candle body back above the key technical level that had to hold.
This is exactly why I always emphasize that price, time, and market structure must be analysed together. Looking at only one timeframe can often create a completely different impression.
From a technical perspective, the new 3-hour candle (TD 8) should ideally trade above the high of TD 7. If the current structure remains intact, the next objective would be a break above the descending trendline, followed by an acceleration toward the Three Drive target around 25,118.
The same principle applies on the lower timeframes. Quick spikes toward 24,822 remain possible at any time. However, as long as those moves are rejected quickly, the market can just as rapidly return toward the 3-hour trendline.
This is also a perfect example of the power of confluence. A trendline, a Three Drive pattern, the TD Sequential count, key pivot levels, liquidity zones, and market timing are all supporting the same technical idea.
One of the biggest misconceptions in technical analysis is believing that higher timeframes are always stronger.
That isn't necessarily true.
A well-connected 15-minute structure with several technical confirmations can often carry more weight than a single trendline on a monthly chart.
It is not the timeframe itself that creates the edge—it is the quality of the pattern and the strength of the technical confluence behind it.
註釋
### A small addition to my previous analysis.After many years of studying the DAX, I have noticed a recurring pattern around the **TD Combo 9 = 13**.
**This is not an official DeMark rule.** It is simply a personal quality filter that evolved through years of observation, chart reviews and live market experience.
Before a high-quality **TD Combo 9 = 13** appears, I often observe the following sequence:
* **Candle 6** is usually the strongest impulse candle of the move and forms the largest real body.
* **Candle 7** often becomes a balance candle. Price initially moves against the trend, then returns, leaving the real body approximately between the upper and lower wicks. To me, this represents a brief equilibrium between buyers and sellers.
* **Candle 8** should restore the momentum. It ideally closes beyond the real body of candle 7 with a strong impulsive body, showing that one side has regained control.
* **Candle 9** then begins directly from that momentum and often creates the final acceleration before exhaustion and liquidity collection occur.
I deliberately focus on **the candle bodies rather than the wicks**, as they better reflect where the market accepted price.
The highest-probability setups occur when this pattern aligns with a **Three Drives formation**, an **AB=CD completion**, a significant **liquidity zone**, and a **Perfected TD Combo 9 = 13**.
For me, this is **not a standalone trading signal**. It is simply another layer of confirmation within a broader technical framework.
As always...
**The market has the final word.**
**– WERKTrader**
*The Black Sheep of Trading*
註釋
Yesterday's TD Combo 9 failed to develop enough momentum. The expected final expansion toward yesterday's R3 around 25,070 never materialized, suggesting that buying pressure weakened into the completion phase.For today, the Pivot shown on the chart remains an important support level. Ideally, buyers should continue defending this area to build enough momentum for a breakout above the upper trendline of the 12H wedge.
With several economic releases ahead, short-term volatility and liquidity sweeps are very possible. A move toward today's S2 would not surprise me. This is the area where I would expect stronger buyers to become active.
As the chart clearly shows, price is still trading inside the upper wedge. If the breakout scenario that I have been discussing all week finally unfolds, I expect the move above the blue trendline to accelerate quickly. Such a breakout will require momentum, and upcoming economic data could provide the catalyst.
If, however, the DAX remains stuck around today's S2–S3 into Thursday afternoon and continues to show a lack of buying strength, we will close our remaining long positions and begin looking for a short entry. In our view, that would signal the beginning of a new market cycle, meaning we would expect a larger reversal even without first reaching the higher upside targets.
One additional point worth monitoring is the current 12H TD candle 4, which will complete in approximately three hours. The way this candle closes may provide valuable information about whether buyers are still building momentum or whether the market is preparing for a broader shift in direction.
WERKTrader – The Black Sheep of Trading
imgur.com/a/3g4i9fU
註釋
註釋
Small correction: The level in the notes should be 24,170 instead of 24,454. The overall scenario remains the same.註釋
Today's Pivot at 24,905 has held perfectly as support, exactly as shown on the chart.
Another interesting technical development is the potential Adam & Eve bottom formation currently taking shape. The falling trendline that is acting as resistance also aligns closely with the neckline of the formation.
Ideally, price would break above the trendline with strong momentum, followed by a controlled pullback to retest the neckline as new support. Such a confirmation would strengthen the bullish structure and could provide the foundation for the next impulsive leg higher.
As always, price confirmation comes first. Until then, this remains a developing technical scenario worth monitoring closely.
WERKTrader
The Black Sheep of Trading
註釋
DAX40 Update – When Different Structures Tell the Same StoryToday's Pivot at 24,905 has held as support so far, just as mentioned in the previous update.
The bullish scenario therefore remains unchanged.
What makes the current market structure particularly interesting is that several independent technical concepts are beginning to align within the same decision zone.
The Island Gap remains open and therefore continues to support the bullish scenario.
At the same time, the previous liquidity sweep can now be interpreted as the potential Adam of a developing Adam & Eve bottom. From a Smart Money perspective, the market first collected sell-side liquidity below the gap before quickly returning to the previous value area.
The current Eve phase suggests that price is gradually building value above the gap rather than continuing lower immediately. This type of price action often reflects institutional accumulation rather than emotional buying.
Another important technical confluence is that the falling wedge resistance aligns almost perfectly with the potential neckline of the Adam & Eve formation.
The ideal sequence would now be:
• Strong breakout above both the wedge resistance and the neckline.
• A controlled pullback to retest the neckline as new support.
• Confirmation of both the Adam & Eve formation and the still-active Island Gap scenario.
• Expansion toward the buy-side liquidity resting above the recent highs.
This is why I believe both patterns are telling the same market story rather than contradicting each other.
The technical narrative
Island Gap → The market accepts higher prices and keeps the gap open.
Adam (Liquidity Sweep) → Sell-side liquidity below the market is collected.
Eve (Accumulation) → Price gradually builds value above the gap as larger market participants quietly establish positions.
Breakout + Neckline Retest → Previous resistance turns into new support, confirming both structures.
Expansion → Momentum accelerates toward the buy-side liquidity resting above the recent highs.
This is precisely why I rarely trade a single pattern in isolation.
My highest-conviction setups occur when multiple independent technical concepts begin telling the same story.
Confluence creates probability. Certainty never exists.
Trading is not about finding certainty.
It is about recognizing when independent technical evidence begins pointing in the same direction.
As always...
The market decides—not the pattern.
WERKTrader
The Black Sheep of Trading
Think Beyond the Candles
註釋
交易結束:目標達成
DAX40 – Trade Update | Target ReachedOur long positions at 24,172 and 24,600 have reached their planned target at today's R3 level (25,345).
This represents a gain of +1,173 and +745 points, respectively.
Our take-profit targets have been executed as planned.
The remaining positions are now protected. Our stop-losses have been moved to yesterday's S2, meaning that even if the market retraces, we will still exit the trade with a profit.
This trade once again demonstrated that the market doesn't reward predictions.
It rewards traders who have a clear trading plan, the discipline to execute it consistently, and the confidence that comes from knowledge, preparation, and experience.
I hope these ongoing updates have helped some of you look at the market from a different perspective and perhaps take away a few ideas that can improve your own trading.
As I've mentioned many times before:
A chart alone is not enough.
Every chart should be supported by a well-defined trading plan.
Knowing where to enter is only a small part of the job.
Equally important is knowing:
when to reduce risk,
when to protect profits,
and when to accept that a trade idea is no longer valid.
That is where technical analysis becomes professional trading.
With this series of updates, my goal was never to prove that I can predict the future or that I know the market better than anyone else.
My intention was simply to give you an honest insight into my daily work and show how I manage a trade—from the initial analysis and risk management all the way to the planned target.
If you enjoy this style of analysis and would like to follow the next trade from the very beginning, I'd be happy to have you along.
The next opportunity will come—when the market provides it.
Until then, I wish you all successful trading.
Always remember:
The market doesn't reward forecasts. It rewards preparation, discipline, and consistent risk management.

免責聲明
這些資訊和出版物並非旨在提供,也不構成TradingView提供或認可的任何形式的財務、投資、交易或其他類型的建議或推薦。請閱讀使用條款以了解更多資訊。
免責聲明
這些資訊和出版物並非旨在提供,也不構成TradingView提供或認可的任何形式的財務、投資、交易或其他類型的建議或推薦。請閱讀使用條款以了解更多資訊。