
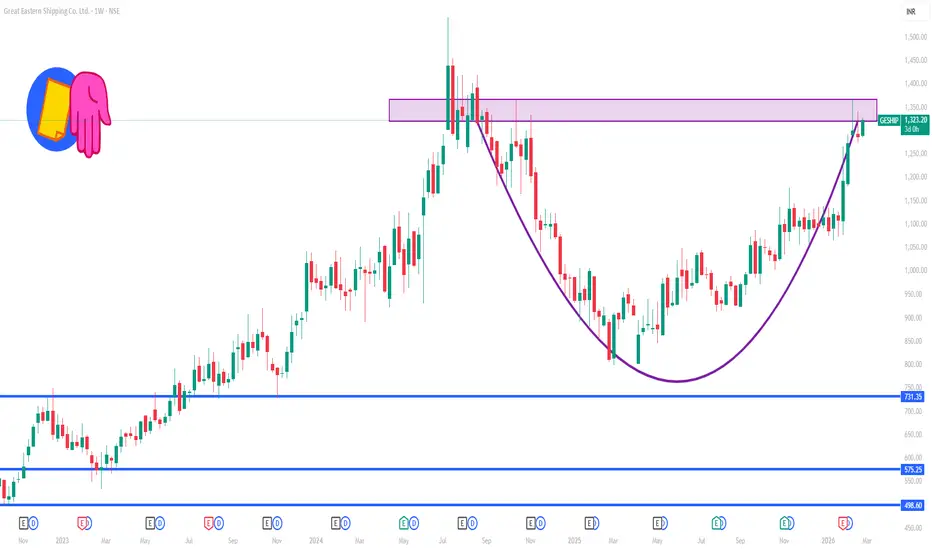
📈 1-Week Technical Levels (Approx — Updated)
🔹 Resistance Levels (Upside Targets)
R1 – ₹1,322 – ₹1,323 — First barrier near recent price action.
R2 – ₹1,344 – ₹1,345 — Next resistance on weekly movers.
R3 – ₹1,358 – ₹1,360+ — Broader supply area if momentum continues.
Higher Resistance Zone ~₹1,376 – ₹1,390 — If broader uptrend extends.
🔻 Support Levels (Downside Floors)
S1 – ₹1,286 – ₹1,287 — Immediate support close to current trading area.
S2 – ₹1,272 – ₹1,273 — Secondary support if price pulls back.
S3 – ₹1,250 – ₹1,252 — Stronger support zone if broader correction occurs.
📊 Current Market Context
RSI near ~68 suggests strength but also indicates the stock is approaching overbought near resistance.
Moving averages (20d/50d) are below current price, implying potential ongoing short-term uptrend.
Daily and weekly momentum indicators are generally bullish, supporting higher resistance levels if buyers sustain above the first few levels.
📌 How to use these levels in a 1-week view
Bullish continuation scenario: A break above R1 (~₹1,322) can open space toward R2 (~₹1,345) and then R3 (~₹1,358+).
Bearish/Correction scenario: Failing near R1–R2 can see prices revisit S1 (~₹1,286), and further down S2/S3 if weakness extends.
🔹 Resistance Levels (Upside Targets)
R1 – ₹1,322 – ₹1,323 — First barrier near recent price action.
R2 – ₹1,344 – ₹1,345 — Next resistance on weekly movers.
R3 – ₹1,358 – ₹1,360+ — Broader supply area if momentum continues.
Higher Resistance Zone ~₹1,376 – ₹1,390 — If broader uptrend extends.
🔻 Support Levels (Downside Floors)
S1 – ₹1,286 – ₹1,287 — Immediate support close to current trading area.
S2 – ₹1,272 – ₹1,273 — Secondary support if price pulls back.
S3 – ₹1,250 – ₹1,252 — Stronger support zone if broader correction occurs.
📊 Current Market Context
RSI near ~68 suggests strength but also indicates the stock is approaching overbought near resistance.
Moving averages (20d/50d) are below current price, implying potential ongoing short-term uptrend.
Daily and weekly momentum indicators are generally bullish, supporting higher resistance levels if buyers sustain above the first few levels.
📌 How to use these levels in a 1-week view
Bullish continuation scenario: A break above R1 (~₹1,322) can open space toward R2 (~₹1,345) and then R3 (~₹1,358+).
Bearish/Correction scenario: Failing near R1–R2 can see prices revisit S1 (~₹1,286), and further down S2/S3 if weakness extends.

Contact Knowledgehub for a detailed consultation: Dm on WhatsApp: [wa.link/a2o0kz]-
Phone No: [+91 93102 26243]-
Email: [tradingviewknowledgehub@gmail.com]---
-- Let’s achieve success together!
Phone No: [+91 93102 26243]-
Email: [tradingviewknowledgehub@gmail.com]---
-- Let’s achieve success together!
相關出版品
免責聲明
這些資訊和出版物並非旨在提供,也不構成TradingView提供或認可的任何形式的財務、投資、交易或其他類型的建議或推薦。請閱讀使用條款以了解更多資訊。
Contact Knowledgehub for a detailed consultation: Dm on WhatsApp: [wa.link/a2o0kz]-
Phone No: [+91 93102 26243]-
Email: [tradingviewknowledgehub@gmail.com]---
-- Let’s achieve success together!
Phone No: [+91 93102 26243]-
Email: [tradingviewknowledgehub@gmail.com]---
-- Let’s achieve success together!
相關出版品
免責聲明
這些資訊和出版物並非旨在提供,也不構成TradingView提供或認可的任何形式的財務、投資、交易或其他類型的建議或推薦。請閱讀使用條款以了解更多資訊。