做多
$GLCH long term view
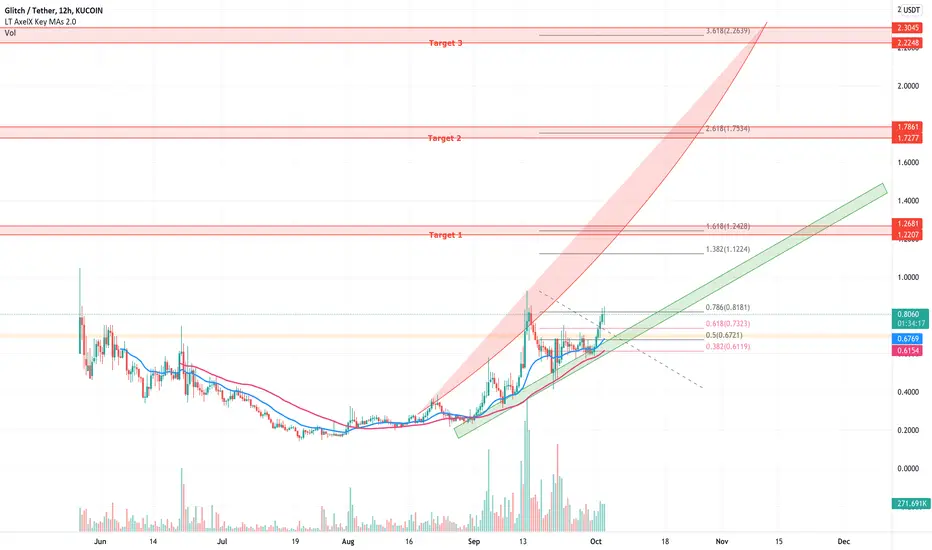
In this chart I show my expectations for $GLCH based on fib level and oversold/ overbought zones.
Red curve = overbought, we see a retranchement every time we get into this zone.
Green curve = accumulation, we get a pump every time we reach this zone.
First target around $1.25.
Target 2: $1.75
Target 3: $2.25
This chart will be updated once we go further in the cycle.
Red curve = overbought, we see a retranchement every time we get into this zone.
Green curve = accumulation, we get a pump every time we reach this zone.
First target around $1.25.
Target 2: $1.75
Target 3: $2.25
This chart will be updated once we go further in the cycle.

免責聲明
這些資訊和出版物並非旨在提供,也不構成TradingView提供或認可的任何形式的財務、投資、交易或其他類型的建議或推薦。請閱讀使用條款以了解更多資訊。