
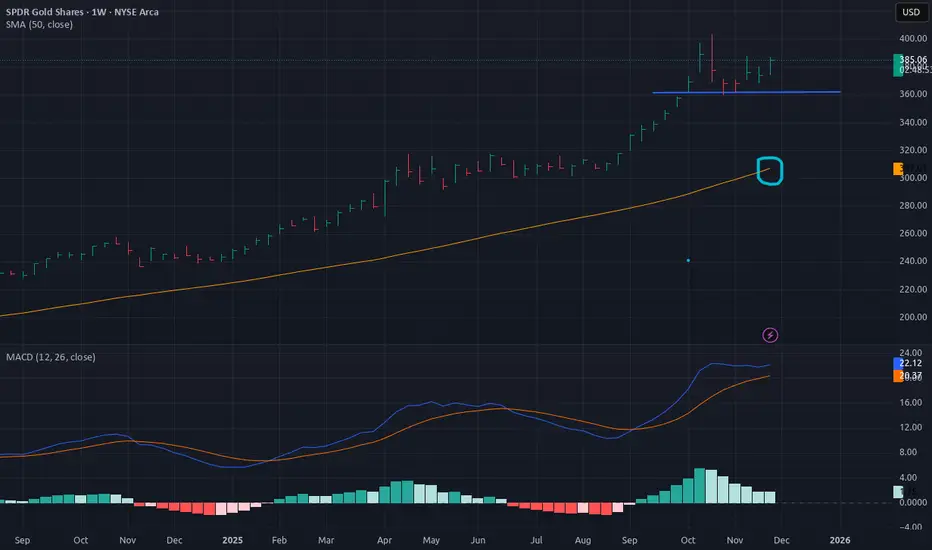
Gold is having a healthy strong weekly uptrend and monthly as well for quite a while.. but will it grow further? sure it can but there's a small negative divergence and distribution ongoing on mid-term which is why gold stuck at these levels at the moment. As for the GLD on weekly and gold in general watch for support level (blue line) and upward moving SMA50 to hold the price in the event of correction.
As of now Gold continues its uptrend, GLD got through the $381 pivot on Daily and shows the sign for the support in current range between $360-380 but the distribution hasn't completed yet.
As of now Gold continues its uptrend, GLD got through the $381 pivot on Daily and shows the sign for the support in current range between $360-380 but the distribution hasn't completed yet.
註釋
P.S.There are many other indicators that are being used for this TA, the above snapshot is only an example.
Moreover, I've been doing technical analysis for quite some time, and I'm neither bullish nor bearish, I'm a swing trader who likes TA. And as you should know - always make your own choices.

免責聲明
這些資訊和出版物並非旨在提供,也不構成TradingView提供或認可的任何形式的財務、投資、交易或其他類型的建議或推薦。請閱讀使用條款以了解更多資訊。
免責聲明
這些資訊和出版物並非旨在提供,也不構成TradingView提供或認可的任何形式的財務、投資、交易或其他類型的建議或推薦。請閱讀使用條款以了解更多資訊。