
GLD | Gold's Weekly Structure Is Deteriorating — Is Another Major Leg Down Coming?
**Ticker:** AMEX:GLD
**Timeframe:** Weekly (1W)
**Bias:** Bearish — Watching for Support Breakdown
Gold has been under sustained selling pressure, and the weekly chart is beginning to tell a compelling story.
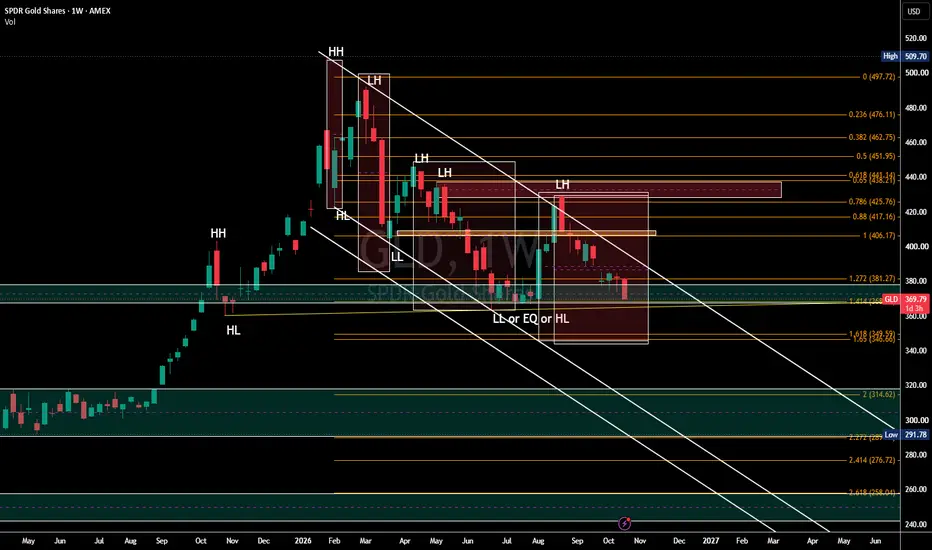
Following its major peak near **$509.70**, GLD has established a sequence of **Lower Highs (LH)**, with price repeatedly failing to reclaim previous supply zones.
The descending trendline continues to act as dynamic resistance, while buyers are struggling to defend the $360–$370 support region.
The key question now: **Are we witnessing a temporary correction, or the beginning of a deeper structural decline in gold?**
### 📉 Technical Structure — Sellers Remain in Control
- **Lower Highs:** Successive rallies have failed to reclaim previous swing highs, indicating weakening bullish momentum.
- **Lower Lows:** The broader correction has produced lower swing lows, although the latest support floor has not yet been decisively broken.
- **Descending Resistance:** Price continues to trade below the major falling trendline.
- **Supply Zones:** The $425–$441 region represents significant overhead resistance.
- **Critical Support:** GLD is testing the $360–$370 demand region.
Until GLD can reclaim its descending resistance structure, rallies should be treated cautiously.
### 🎯 Key GLD Levels to Watch
**Immediate support**
- $369–$370 — Current support test
- $360 — Important horizontal support
- $349.59 — Fibonacci 1.618 extension
- $346.66 — Fibonacci 1.65 extension
**Bearish extension targets**
- $314.62 — Fibonacci 2.0
- $291.78 — Major historical support
- $258.04 — Fibonacci 2.618
**Upside resistance**
- $381.27 — First recovery level
- $406.17 — Major resistance / prior structure
- $425.76 — Fibonacci 0.786
- $438.21–$441.14 — Higher supply / resistance
### 🌎 Macro Perspective — Why Is Gold Under Pressure?
Gold's weakness cannot be explained by chart structure alone.
**1. Higher Treasury Yields**
Elevated U.S. Treasury yields increase the opportunity cost of holding gold, an asset that produces no interest income.
**2. Federal Reserve Policy**
Persistent inflation and uncertainty surrounding additional monetary tightening are challenging gold's near-term outlook. Higher-for-longer interest rates can remain a headwind.
**3. U.S. Dollar Strength**
A stronger dollar generally creates pressure on dollar-denominated gold by making it more expensive for international buyers.
**4. Inflation and Geopolitical Risk**
Inflation and geopolitical uncertainty can support gold as a long-term hedge. However, when inflation leads to expectations of tighter monetary policy and higher real yields, gold can decline even during periods of uncertainty.
**5. Structural Demand**
Central-bank accumulation, investment demand, and diversification away from traditional reserve assets remain potential long-term supports. These forces can coexist with a bearish technical correction.
### 🔴 Bearish Scenario
A confirmed weekly breakdown below **$360** would strengthen the bearish structure and expose:
**$349.59 → $346.66 → $314.62 → $291.78**
The $314.62 region becomes particularly interesting as the 2.0 Fibonacci extension and a potential longer-term reaction area.
### 🟢 Bullish Recovery Scenario
If buyers defend $360–$370, GLD could attempt a relief rally toward:
**$381.27 → $406.17 → $425.76**
A sustained weekly recovery above $406.17 would be an early sign of improving structure. Reclaiming the $425–$441 resistance region would provide stronger evidence that sellers are losing control.
### 📌 Conclusion
**Price structure comes first. Macro provides the context.**
GLD remains technically vulnerable as long as the sequence of lower highs persists.
The $360 region is the immediate battleground. A decisive breakdown may accelerate selling toward the deeper Fibonacci extensions, while a defended support zone could produce a meaningful countertrend recovery.
Gold's long-term investment case may remain intact, but that does not automatically make the current technical structure bullish.
**Trade the structure, not the narrative.**
*This analysis represents market observations and conditional scenarios, not financial advice.*

QuantriumFlow™ · Unified Market Structure Engine
Structure • Delta Zones • Cross-Market Confirmation
Options-flow analytics framework for QQQ, SPY, Futures and beyond.
Join Discord for daily levels: discord.gg/BNdfuAwTAd
Not Financial Advice.
Structure • Delta Zones • Cross-Market Confirmation
Options-flow analytics framework for QQQ, SPY, Futures and beyond.
Join Discord for daily levels: discord.gg/BNdfuAwTAd
Not Financial Advice.
免責聲明
這些資訊和出版物並非旨在提供,也不構成TradingView提供或認可的任何形式的財務、投資、交易或其他類型的建議或推薦。請閱讀使用條款以了解更多資訊。