
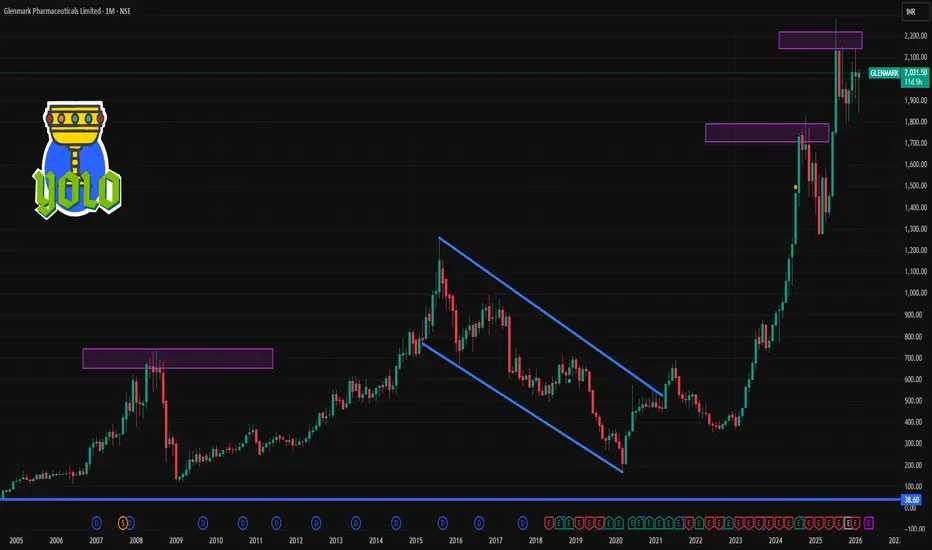
📍 Current Price Context
Price around ₹2,000 – ₹2,030 (recent trading zone) on the NSE.
52-week range roughly ₹1,275 – ₹2,284 indicating broader volatility context.
📈 1-Month Key Levels (Support / Resistance)
🛑 Resistance Levels
These price areas where the stock has historically faced selling pressure or may find difficulty rising past in the near term:
R1 – ~₹2,033 – ₹2,040 → immediate barrier near recent peaks.
R2 – ~₹2,068 – ₹2,070 → stronger resistance zone from pivot studies.
R3 – ~₹2,088 – ₹2,089 → upper short-term cap/important zone before recent all-time highs.
👉 A break above ₹2,070–₹2,090 with volume could signal a short-term breakout.
🧱 Support Levels
These are zones where buyers have historically stepped in or price has found a base:
S1 – ~₹1,977–₹1,988 → first meaningful support near short-term moving averages.
S2 – ~₹1,956–₹1,960 → deeper support from recent pivot analysis.
S3 – ~₹1,920 – ₹1,921 → lower side of the recent month range, key buffer before bigger decline.
👉 If support at ~₹1,977–₹1,988 breaks decisively, price could test ₹1,920 or below on short-term weakness.
📊 Moving Averages Snapshot
Short-term averages (~20/50 day) are around ₹1,980–₹1,995, acting as dynamic supports or resistances depending on price action:
Above averages = stronger near-term bias
Below averages = consolidation/weakness
🧠 1-Month Price Range Summary
Possible trading range:
✔ Upside target: ~₹2,068–₹2,089
✔ Immediate resistance: ~₹2,033–₹2,040
✔ Support levels: ~₹1,977–₹1,960 → deeper support ~₹1,920
A breakout above ₹2,070 can be bullish short-term, while a sustained break below ₹1,977 adds bearish pressure.
Price around ₹2,000 – ₹2,030 (recent trading zone) on the NSE.
52-week range roughly ₹1,275 – ₹2,284 indicating broader volatility context.
📈 1-Month Key Levels (Support / Resistance)
🛑 Resistance Levels
These price areas where the stock has historically faced selling pressure or may find difficulty rising past in the near term:
R1 – ~₹2,033 – ₹2,040 → immediate barrier near recent peaks.
R2 – ~₹2,068 – ₹2,070 → stronger resistance zone from pivot studies.
R3 – ~₹2,088 – ₹2,089 → upper short-term cap/important zone before recent all-time highs.
👉 A break above ₹2,070–₹2,090 with volume could signal a short-term breakout.
🧱 Support Levels
These are zones where buyers have historically stepped in or price has found a base:
S1 – ~₹1,977–₹1,988 → first meaningful support near short-term moving averages.
S2 – ~₹1,956–₹1,960 → deeper support from recent pivot analysis.
S3 – ~₹1,920 – ₹1,921 → lower side of the recent month range, key buffer before bigger decline.
👉 If support at ~₹1,977–₹1,988 breaks decisively, price could test ₹1,920 or below on short-term weakness.
📊 Moving Averages Snapshot
Short-term averages (~20/50 day) are around ₹1,980–₹1,995, acting as dynamic supports or resistances depending on price action:
Above averages = stronger near-term bias
Below averages = consolidation/weakness
🧠 1-Month Price Range Summary
Possible trading range:
✔ Upside target: ~₹2,068–₹2,089
✔ Immediate resistance: ~₹2,033–₹2,040
✔ Support levels: ~₹1,977–₹1,960 → deeper support ~₹1,920
A breakout above ₹2,070 can be bullish short-term, while a sustained break below ₹1,977 adds bearish pressure.

Contact Knowledgehub for a detailed consultation: Dm on WhatsApp: [wa.link/a2o0kz]-
Phone No: [+91 93102 26243]-
Email: [tradingviewknowledgehub@gmail.com]---
-- Let’s achieve success together!
Phone No: [+91 93102 26243]-
Email: [tradingviewknowledgehub@gmail.com]---
-- Let’s achieve success together!
相關出版品
免責聲明
這些資訊和出版物並非旨在提供,也不構成TradingView提供或認可的任何形式的財務、投資、交易或其他類型的建議或推薦。請閱讀使用條款以了解更多資訊。
Contact Knowledgehub for a detailed consultation: Dm on WhatsApp: [wa.link/a2o0kz]-
Phone No: [+91 93102 26243]-
Email: [tradingviewknowledgehub@gmail.com]---
-- Let’s achieve success together!
Phone No: [+91 93102 26243]-
Email: [tradingviewknowledgehub@gmail.com]---
-- Let’s achieve success together!
相關出版品
免責聲明
這些資訊和出版物並非旨在提供,也不構成TradingView提供或認可的任何形式的財務、投資、交易或其他類型的建議或推薦。請閱讀使用條款以了解更多資訊。