做多
Multi-Timeframe Analysis: GM
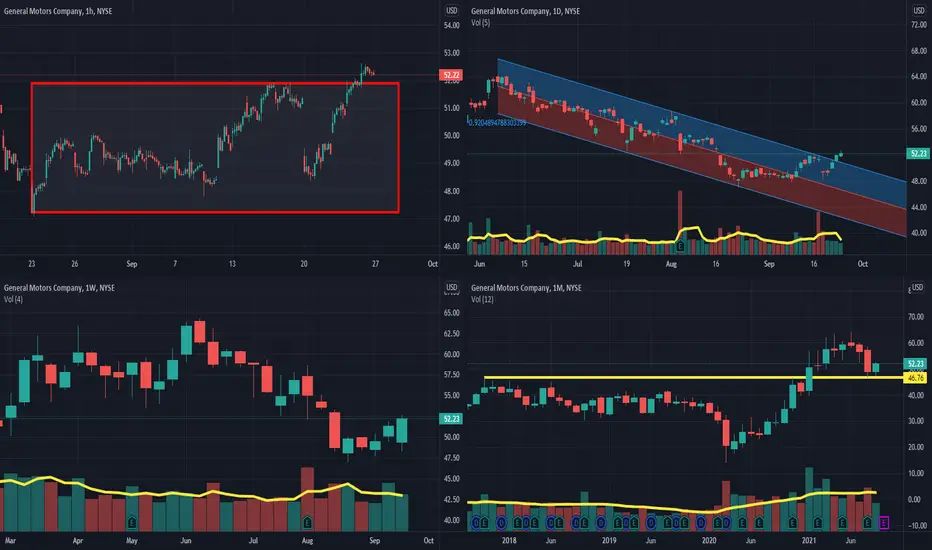
Multi-Timeframe Analysis:
Hourly Chart: getting out of consolidation pattern ( Bullish )
Daily Chart: getting out of downward regression channel + Three white soldiers pattern ( Bullish )
Trading volume in comparison to the last 5 days:
Weekly Chart: Bullish Outside bar
Trading volume in comparison to the last 4 weeks:+4%
Monthly Chart: Price action to support level.
Trading volume in comparison to the last 12 months:
Conclusion: I believe GM could take its previous top back, and even move further..!

Use the following link to access trading ideas: patreon.com/SniperTraderStocks?utm_medium=unknown&utm_source=join_link&utm_campaign=creatorshare_creator&utm_content=copyLink
免責聲明
這些資訊和出版物並非旨在提供,也不構成TradingView提供或認可的任何形式的財務、投資、交易或其他類型的建議或推薦。請閱讀使用條款以了解更多資訊。
Use the following link to access trading ideas: patreon.com/SniperTraderStocks?utm_medium=unknown&utm_source=join_link&utm_campaign=creatorshare_creator&utm_content=copyLink
免責聲明
這些資訊和出版物並非旨在提供,也不構成TradingView提供或認可的任何形式的財務、投資、交易或其他類型的建議或推薦。請閱讀使用條款以了解更多資訊。