
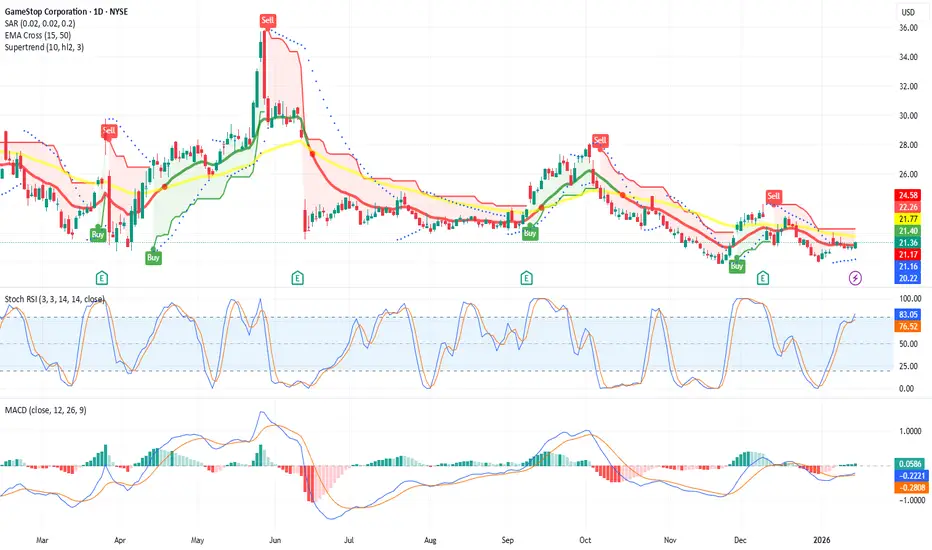
GME: Bearish daily chart
Short term support: $20.26
Short term resistance: $22.26
Short term indicators:
Weekly chart: sell
Monthly chart: buy
Fundamentals are strong.
Short term support: $20.26
Short term resistance: $22.26
Short term indicators:
- Par SAR: buy
- EMA cross: sell
- Supertrend: sell
- Stoch RSI: buy (but overbought)
- MACD: buy
Weekly chart: sell
Monthly chart: buy
Fundamentals are strong.

免責聲明
這些資訊和出版物並非旨在提供,也不構成TradingView提供或認可的任何形式的財務、投資、交易或其他類型的建議或推薦。請閱讀使用條款以了解更多資訊。
免責聲明
這些資訊和出版物並非旨在提供,也不構成TradingView提供或認可的任何形式的財務、投資、交易或其他類型的建議或推薦。請閱讀使用條款以了解更多資訊。