已更新
Golem Trend Change
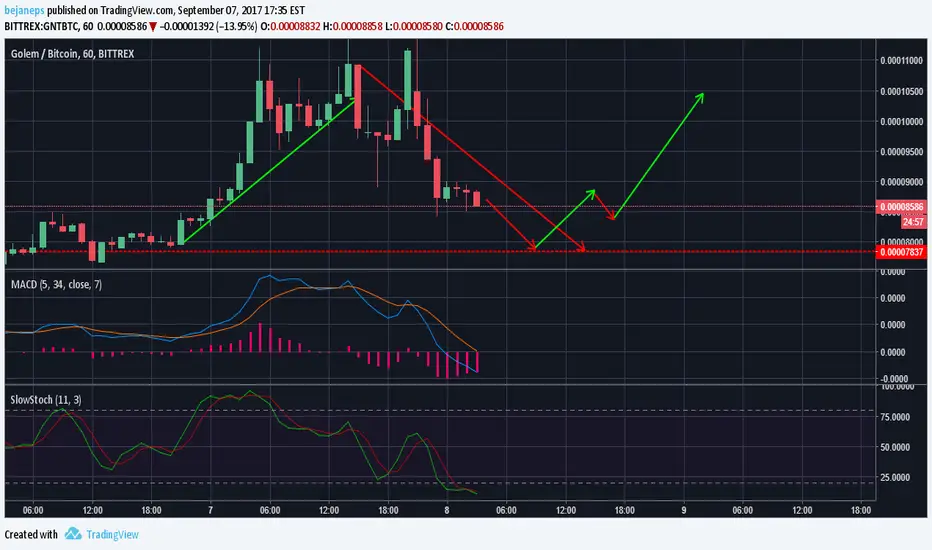
General: approximately in 4-12 hours we can capture trend change. Price will go down till support line or a bit higher than support. Waiting for MACD Indicator to change DMI+ and DMI- lines.
Indicators: MACD showing that histogram is getting weaker and distance between DMI+ and DMI+ is decreasing. By looking at Slow Stochastic we can observe that fast line is jumping from lower limit.
Profit: Take profit on 10%-20% and put your stop-limits at support line.
Good luck and take care !
Indicators: MACD showing that histogram is getting weaker and distance between DMI+ and DMI+ is decreasing. By looking at Slow Stochastic we can observe that fast line is jumping from lower limit.
Profit: Take profit on 10%-20% and put your stop-limits at support line.
Good luck and take care !
交易進行
Waiting for trend change, keep your coins.手動結束交易
Bad qualified conference from Golem team, price effected greatly.
免責聲明
這些資訊和出版物並非旨在提供,也不構成TradingView提供或認可的任何形式的財務、投資、交易或其他類型的建議或推薦。請閱讀使用條款以了解更多資訊。