
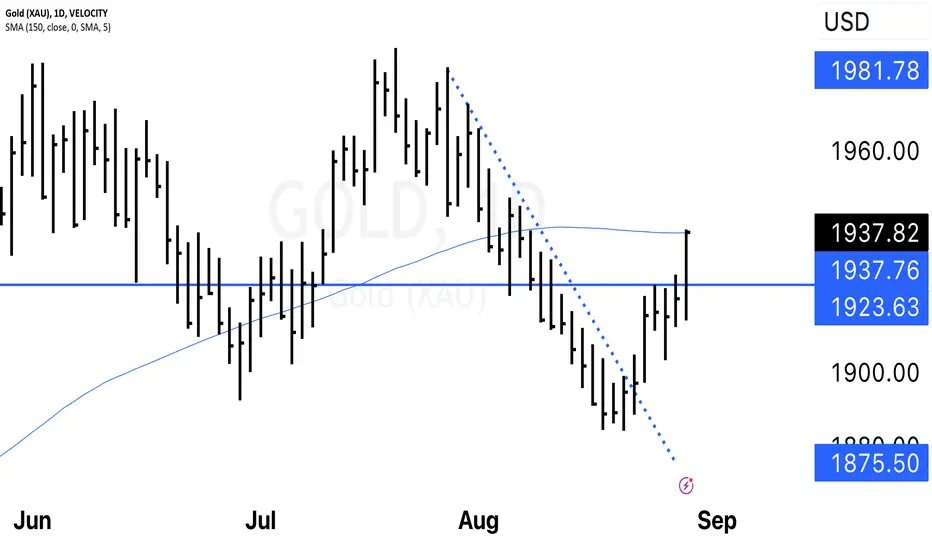
 GLD Bearish To bullish Reversal The technical analysis of the bearish-to-bullish reversal in the context of the GLD (SPDR Gold Trust ETF) involves the observation of key price actions, trend lines, and moving averages. This analysis suggests a potential shift in sentiment from bearish to bullish.
**Bearish to Bullish Reversal:**
The first notable point is the transition from a bearish trend to a potential bullish reversal. A bearish trend is characterized by a series of lower lows and lower highs, indicating a prevailing downward movement. A reversal, on the other hand, suggests a shift in sentiment and price direction.
**Down Sloping Trend Line Break:**
The breakout of a down-sloping trend line is a significant technical event. Trend lines are drawn by connecting a series of highs or lows, and a down-sloping trend line connects declining highs. The breakout above this trend line indicates that the price has overcome the resistance posed by the trend, suggesting increased buying interest and potential bullish momentum.
**Testing the 150-Day Moving Average:**
The 150-day moving average is a crucial technical indicator that smooths out price fluctuations over a relatively longer period. It serves as a dynamic support or resistance level. When the price tests the moving average from below, it signifies a potential reversal point. In this case, the test of the 150-day moving average after the trend line breakout further supports the idea of a potential bullish reversal.
**Confirmation and Further Analysis:**
For this potential reversal scenario to gain more credibility, it's important to look for confirming factors:
1. **Volume Analysis:** An increase in trading volume during the breakout and subsequent price movement lends strength to the reversal. Higher volume indicates increased market participation and conviction.
2. **Follow-Through:** After breaking the down-sloping trend line and testing the 150-day moving average, the price ideally should continue to rise. The sustained upward movement after the initial breakout adds more confidence to the bullish reversal thesis.
3. **Relative Strength and Momentum Indicators:** Analyzing indicators like the Relative Strength Index (RSI) and Moving Average Convergence Divergence (MACD) can provide insight into the strength of the reversal and whether it's in line with other technical signals.
4. **Support Levels:** Identify nearby support levels, such as previous swing highs or the recently broken down-sloping trend line. These levels can act as potential support in case of a pullback.
It's important to note that technical analysis provides probabilities rather than certainties. While a bullish reversal scenario seems plausible based on the trend line breakout and testing of the moving average, it's essential to consider the broader market context, news, and fundamental factors that might impact the price of GLD. Successful trading decisions often involve a holistic approach that incorporates both technical and fundamental analysis.

免責聲明
這些資訊和出版物並非旨在提供,也不構成TradingView提供或認可的任何形式的財務、投資、交易或其他類型的建議或推薦。請閱讀使用條款以了解更多資訊。
免責聲明
這些資訊和出版物並非旨在提供,也不構成TradingView提供或認可的任何形式的財務、投資、交易或其他類型的建議或推薦。請閱讀使用條款以了解更多資訊。