
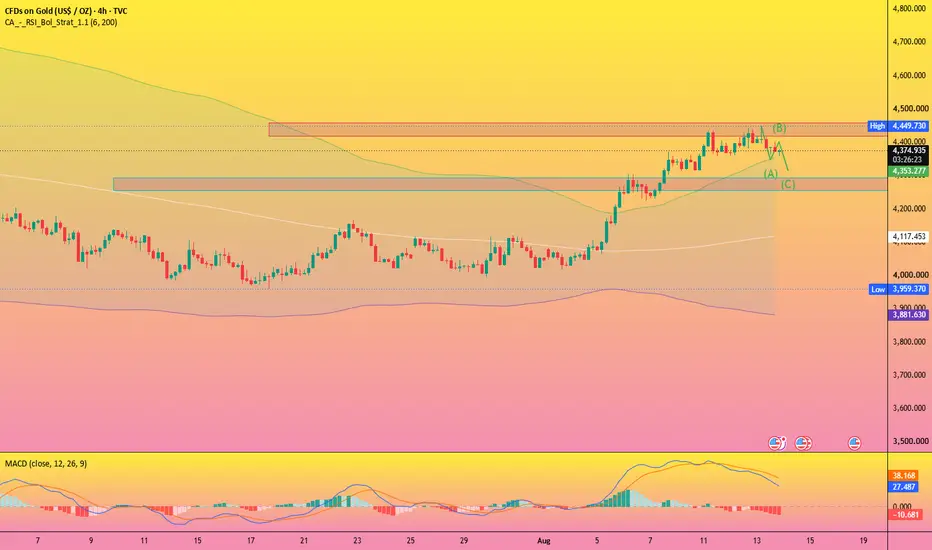
From a daily chart perspective, a distinct bullish trend remains intact; the price is trading above the 100-day moving average (approx. $4,390) and the middle band of the Bollinger Bands (approx. $4,140), indicating that the medium-term bullish structure has not yet been compromised. Gold prices have been trending toward the upper Bollinger Band—currently situated around $4,410—making the $4,400–$4,410 zone a critical battleground for bulls and bears in the short term. The 14-day Relative Strength Index (RSI) stands at approximately 67.5, nearing the overbought zone; while this signals strong upward momentum, it also suggests a risk of technical correction in the short term.
If the bulls can decisively break through and stabilize above $4,410, it would imply that the current consolidation at high levels could resume its upward trajectory, with the $4,450 level and the $4,500 psychological mark becoming the next points of interest. Conversely, if the price fails to break $4,410 and falls back below $4,390, short-term downward pressure will intensify; initial support would be sought near $4,350, followed by the Bollinger middle band at approximately $4,140. Only a sustained drop below the middle band would truly undermine the current strong bullish structure on the daily chart.
On the 4-hour chart, gold is showing signs of a pullback from recent highs, with short-term momentum slowing compared to earlier levels. The $4,400 mark serves as both a psychological threshold and a key technical zone near the current price. If gold finds support in the $4,350–$4,380 range and reclaims the $4,410 level, the bulls could regain the initiative and push toward $4,450 and beyond. However, a decisive break below $4,350 on the 4-hour chart could signal a more pronounced correction phase, shifting the focus to support levels at $4,310 or even $4,300.
交易結束:目標達成
This analysis accurately aligns with the objectives, ensuring good results regardless of whether the trade is long or short.註釋
Gold retraced from $4,450 to the $4,310 target, a decline of $140 per ounce.
免責聲明
這些資訊和出版物並非旨在提供,也不構成TradingView提供或認可的任何形式的財務、投資、交易或其他類型的建議或推薦。請閱讀使用條款以了解更多資訊。