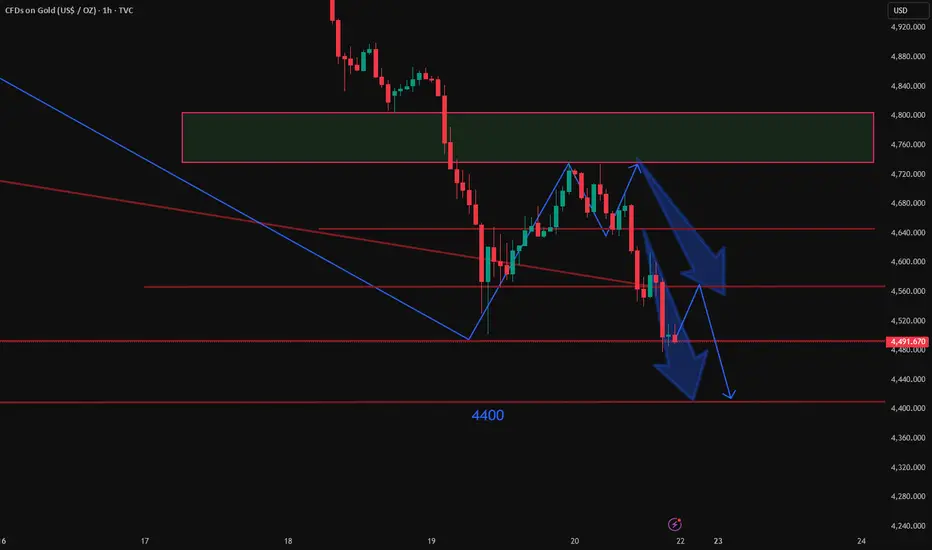
Dear friends, London spot gold experienced a brutal flash crash this week—plunging from a high of $5015 to a low of $4477 on Friday, a weekly drop of over 10%, marking the largest weekly decline in six years. The bulls completely collapsed, solidifying the overall bear market trend.
The Federal Reserve's FOMC meeting was the core catalyst for this plunge: the Fed kept interest rates unchanged, while market expectations for a rate cut in 2026 were significantly lowered to just one. Chairman Powell delivered extremely hawkish remarks, emphasizing inflation resilience and opening the door to further rate hikes—completely shattering market dovish expectations. The US dollar index (DXY) and US Treasury yields surged simultaneously, significantly increasing the cost of holding gold. Coupled with a massive influx of safe-haven funds into the dollar, gold's safe-haven appeal vanished.
Looking ahead, next week the market will continue to digest the impact of the Fed's hawkish policy shift, with no clear bullish fundamental drivers—gold may face continued selling pressure.
From a technical perspective, the bearish engulfing pattern on the weekly chart confirms a complete trend reversal, with minimal short-term rebound momentum. The daily chart shows a series of heavy bearish candles, breaking below all key moving averages (MAs), which are currently in a textbook bearish alignment. The MACD histogram continues to expand, and the KDJ indicator remains in oversold territory, but the downward momentum shows no signs of abating—there are no bottoming signals whatsoever. On the 4-hour chart, the bearish pattern persists; the MACD histogram is contracting, suggesting a possible slight technical pullback, but no reversal signal has yet emerged, and any rebounds have been very weak.
In the short term, $4577 to $4613 constitute strong resistance, while $4735 is a key medium-term level. The downside support at $4450 is very fragile—a break below this level could see gold prices fall further to the $4200-$4300 range, with significant downside potential. Next week, gold prices may exhibit a pattern of "weak rebound followed by further declines"; minor technical pullbacks are insufficient to reverse the downtrend. Unless gold prices can hold above $4,700, the weak downtrend remains intact.
Trading Strategy: Maintain a bearish stance – only short, no long, and use pullbacks to short and trade with the trend. Strictly avoid bottom-fishing risks.
Gold Trading Recommendation: Establish short positions when gold prices rebound to the $4,545-$4,560 range.
We welcome all traders to share their opinions, and let's move forward together in this market.
 XAUUSD XAUUSD XAUUSD GOLD1!
The Federal Reserve's FOMC meeting was the core catalyst for this plunge: the Fed kept interest rates unchanged, while market expectations for a rate cut in 2026 were significantly lowered to just one. Chairman Powell delivered extremely hawkish remarks, emphasizing inflation resilience and opening the door to further rate hikes—completely shattering market dovish expectations. The US dollar index (DXY) and US Treasury yields surged simultaneously, significantly increasing the cost of holding gold. Coupled with a massive influx of safe-haven funds into the dollar, gold's safe-haven appeal vanished.
Looking ahead, next week the market will continue to digest the impact of the Fed's hawkish policy shift, with no clear bullish fundamental drivers—gold may face continued selling pressure.
From a technical perspective, the bearish engulfing pattern on the weekly chart confirms a complete trend reversal, with minimal short-term rebound momentum. The daily chart shows a series of heavy bearish candles, breaking below all key moving averages (MAs), which are currently in a textbook bearish alignment. The MACD histogram continues to expand, and the KDJ indicator remains in oversold territory, but the downward momentum shows no signs of abating—there are no bottoming signals whatsoever. On the 4-hour chart, the bearish pattern persists; the MACD histogram is contracting, suggesting a possible slight technical pullback, but no reversal signal has yet emerged, and any rebounds have been very weak.
In the short term, $4577 to $4613 constitute strong resistance, while $4735 is a key medium-term level. The downside support at $4450 is very fragile—a break below this level could see gold prices fall further to the $4200-$4300 range, with significant downside potential. Next week, gold prices may exhibit a pattern of "weak rebound followed by further declines"; minor technical pullbacks are insufficient to reverse the downtrend. Unless gold prices can hold above $4,700, the weak downtrend remains intact.
Trading Strategy: Maintain a bearish stance – only short, no long, and use pullbacks to short and trade with the trend. Strictly avoid bottom-fishing risks.
Gold Trading Recommendation: Establish short positions when gold prices rebound to the $4,545-$4,560 range.
We welcome all traders to share their opinions, and let's move forward together in this market.
XAUUSD XAUUSD XAUUSD GOLD1! 
免責聲明
這些資訊和出版物並非旨在提供,也不構成TradingView提供或認可的任何形式的財務、投資、交易或其他類型的建議或推薦。請閱讀使用條款以了解更多資訊。
免責聲明
這些資訊和出版物並非旨在提供,也不構成TradingView提供或認可的任何形式的財務、投資、交易或其他類型的建議或推薦。請閱讀使用條款以了解更多資訊。