
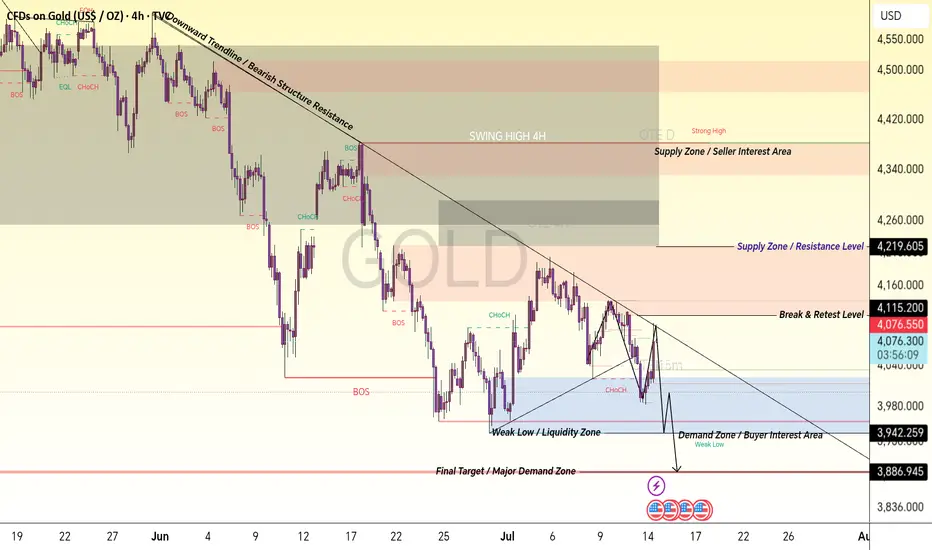
XAU/USD 4H Smart Money Concept Detailed Candle-by-Candle Analysis
Gold 4H chart is showing a complete market structure transition where every candle reflects the battle between buyers and sellers. The price started from higher levels with strong selling pressure after reaching the premium supply area. The early candles created rejection wicks, showing that sellers were defending the upper zone and preventing further upside continuation.
After the rejection from the high area, bearish candles started forming lower highs and lower lows. This sequence confirmed that sellers were gaining control. The first major Break of Structure (BOS) occurred when price broke previous swing lows, indicating a shift from bullish momentum into a bearish structure.
During the downward move, candles continued respecting the descending trendline, which acted as dynamic resistance. Each pullback candle toward this trendline showed weak buying strength, while rejection candles confirmed continuous seller interest. This created a clear bearish channel where smart money continued distributing positions.
After reaching the lower range, price formed a temporary recovery phase. Green bullish candles appeared as buyers entered from the demand area, creating a short-term Change of Character (CHoCH). However, the recovery failed to break the major supply zone, showing that buyers were not strong enough to reverse the overall trend.
The candles near the Supply Zone / Resistance Area showed hesitation and rejection. Multiple small-bodied candles indicated uncertainty, while bearish engulfing movements confirmed that sellers were still active. This area became a key reaction point for future price movement.
The next sequence of candles created another bearish leg, breaking previous support levels and confirming continuation of the downtrend. The strong bearish candles represented aggressive selling pressure, while small retracement candles showed weak attempts from buyers to regain control.
Near the Weak Low / Liquidity Zone, candles started moving sideways, indicating accumulation and liquidity building. The market created equal or nearby lows where stop liquidity may be resting. Smart money often targets these liquidity areas before making the next directional move.
The latest candles are showing reaction from the Demand Zone / Buyer Interest Area. Buyers are attempting to defend this region, but confirmation is required through a strong CHoCH or BOS before considering a complete reversal.
If price breaks below the demand zone, bearish continuation can target the Final Target / Major Demand Zone where stronger buying interest may appear. If buyers successfully defend the zone and break above resistance levels, price can move toward higher supply areas.
Complete Market Story:
Higher Timeframe: Bearish structure remains active.
Trendline: Sellers are controlling momentum below resistance.
Supply Zone: Main selling area and rejection point.
BOS: Confirms seller dominance.
Demand Zone: Buyer reaction area.
Liquidity Zone: Possible stop hunt area before next move.
Final Demand: Major area where institutional buyers may react.
This chart demonstrates Smart Money Concept analysis using market structure, liquidity, supply & demand, BOS, CHoCH, and trendline reactions to understand institutional price movement. Always wait for confirmation before entering any trade.
Gold 4H chart is showing a complete market structure transition where every candle reflects the battle between buyers and sellers. The price started from higher levels with strong selling pressure after reaching the premium supply area. The early candles created rejection wicks, showing that sellers were defending the upper zone and preventing further upside continuation.
After the rejection from the high area, bearish candles started forming lower highs and lower lows. This sequence confirmed that sellers were gaining control. The first major Break of Structure (BOS) occurred when price broke previous swing lows, indicating a shift from bullish momentum into a bearish structure.
During the downward move, candles continued respecting the descending trendline, which acted as dynamic resistance. Each pullback candle toward this trendline showed weak buying strength, while rejection candles confirmed continuous seller interest. This created a clear bearish channel where smart money continued distributing positions.
After reaching the lower range, price formed a temporary recovery phase. Green bullish candles appeared as buyers entered from the demand area, creating a short-term Change of Character (CHoCH). However, the recovery failed to break the major supply zone, showing that buyers were not strong enough to reverse the overall trend.
The candles near the Supply Zone / Resistance Area showed hesitation and rejection. Multiple small-bodied candles indicated uncertainty, while bearish engulfing movements confirmed that sellers were still active. This area became a key reaction point for future price movement.
The next sequence of candles created another bearish leg, breaking previous support levels and confirming continuation of the downtrend. The strong bearish candles represented aggressive selling pressure, while small retracement candles showed weak attempts from buyers to regain control.
Near the Weak Low / Liquidity Zone, candles started moving sideways, indicating accumulation and liquidity building. The market created equal or nearby lows where stop liquidity may be resting. Smart money often targets these liquidity areas before making the next directional move.
The latest candles are showing reaction from the Demand Zone / Buyer Interest Area. Buyers are attempting to defend this region, but confirmation is required through a strong CHoCH or BOS before considering a complete reversal.
If price breaks below the demand zone, bearish continuation can target the Final Target / Major Demand Zone where stronger buying interest may appear. If buyers successfully defend the zone and break above resistance levels, price can move toward higher supply areas.
Complete Market Story:
Higher Timeframe: Bearish structure remains active.
Trendline: Sellers are controlling momentum below resistance.
Supply Zone: Main selling area and rejection point.
BOS: Confirms seller dominance.
Demand Zone: Buyer reaction area.
Liquidity Zone: Possible stop hunt area before next move.
Final Demand: Major area where institutional buyers may react.
This chart demonstrates Smart Money Concept analysis using market structure, liquidity, supply & demand, BOS, CHoCH, and trendline reactions to understand institutional price movement. Always wait for confirmation before entering any trade.
交易進行
XAU/USD Buy Trade Active
Entry: 4100
Current Status: +900 Pips Running Profit
Trade is moving according to the planned market structure. Price is respecting the demand area and showing strong buyer interest. Maintain discipline and follow the trading plan.
Secure partial profits according to your risk management
Hold remaining position for the last target
Follow the chart levels and wait for confirmation
Avoid emotional exits and protect the running profit
SMC Setup Remains Valid — Let the price reach the final target while respecting key support and structure levels
手動結束交易
Trade Management Update – XAU/USDTrade has been managed successfully according to the plan.
✅ 50% position closed manually to secure profits.
✅ Remaining 50% position is still active and held for the final target.
Price is respecting the planned structure, so we continue following the chart levels with proper risk management. Avoid emotional exits and let the remaining position run toward the last target while protecting profits.
50% Booked ✅ | 50% Holding for Final Target 🎯 | Follow the Plan
註釋
🚀 XAU/USD Trade Update
Trade is now running with +1100 pips profit from the planned entry.
Price is moving according to the analysis and respecting the key market structure levels.
✅ Strong momentum achieved
✅ Profit secured according to risk management
✅ Remaining position continues toward the final target 🎯
Stay disciplined, follow the chart structure, and protect the running profit with proper trade management.
+1100 Pips Running Profit ✅ | Hold for Final Target 🎯

t.me/+HstI692sUGw0ZmRk
✅ MY FREE SIGNALS CHANNEL
✅ PERSONAL TELEGRAM
✅ FOREX BROKER USED
t.me/+pg7FHDH9Zl40MGJk
✅ MY FREE SIGNALS CHANNEL
✅ PERSONAL TELEGRAM
✅ FOREX BROKER USED
t.me/+pg7FHDH9Zl40MGJk
相關出版品
免責聲明
這些資訊和出版物並非旨在提供,也不構成TradingView提供或認可的任何形式的財務、投資、交易或其他類型的建議或推薦。請閱讀使用條款以了解更多資訊。
t.me/+HstI692sUGw0ZmRk
✅ MY FREE SIGNALS CHANNEL
✅ PERSONAL TELEGRAM
✅ FOREX BROKER USED
t.me/+pg7FHDH9Zl40MGJk
✅ MY FREE SIGNALS CHANNEL
✅ PERSONAL TELEGRAM
✅ FOREX BROKER USED
t.me/+pg7FHDH9Zl40MGJk
相關出版品
免責聲明
這些資訊和出版物並非旨在提供,也不構成TradingView提供或認可的任何形式的財務、投資、交易或其他類型的建議或推薦。請閱讀使用條款以了解更多資訊。