
DEAR TRADERS,
PLEASE FIND GOLD TECHNICAL ANAYLYSIS ON 4H CHART.
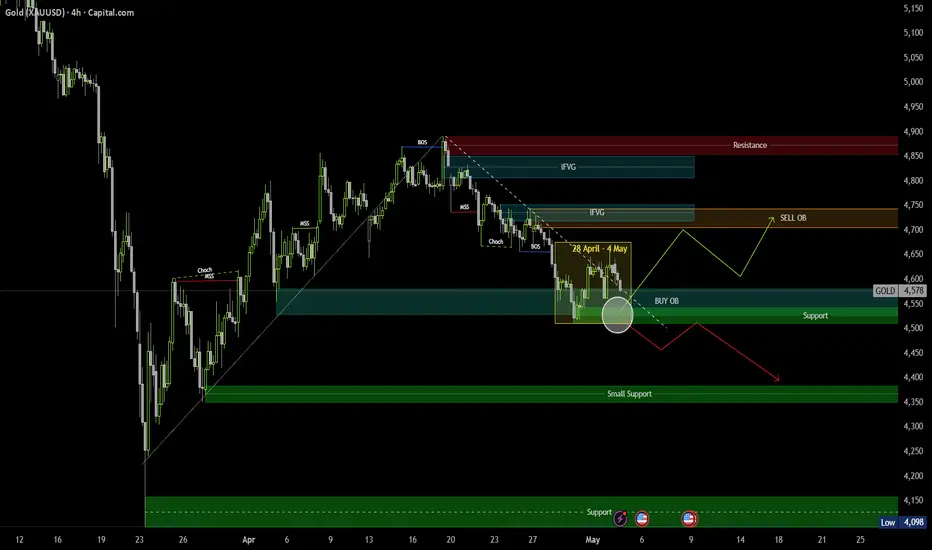
📊 GOLD MARKET STRUCTURE ANALYSIS (28 April – 4 May)
Gold has transitioned from a bullish structure into a clear bearish phase after forming a Break of Structure (BOS) at the highs, followed by a Market Structure Shift (MSS) and a confirmed Change of Character (CHoCH).
Price is currently trending downward within a controlled bearish channel, respecting lower highs and lower lows.
🔍 Key Zones to Watch:
Sell Zone (Premium Area):
The marked iFVG (Inverse Fair Value Gap) aligned with the Order Block (OB) above current price remains a strong resistance zone.
Any pullback into this area is likely to offer sell opportunities.
Buy Zone (Discount Area):
Price is currently reacting from a Buy Order Block (OB) sitting within a strong support zone.
This area may produce a short-term bounce, but it remains a counter-trend move unless structure shifts.
📉 Scenario Outlook:
Bearish Continuation (Primary Bias):
If price fails to break above the sell OB / iFVG zone, expect continuation downward targeting:
Immediate support
Then lower support zone (small support area)
Bullish Pullback (Secondary Scenario):
A reaction from the current support could push price back into the premium zone (sell OB), where sellers are expected to step in again.
⚠️ Key Insight:
The overall structure remains bearish, and buy positions should be treated as short-term unless a new bullish BOS forms.
The Quantum Trading Mastery
PLEASE FIND GOLD TECHNICAL ANAYLYSIS ON 4H CHART.
📊 GOLD MARKET STRUCTURE ANALYSIS (28 April – 4 May)
Gold has transitioned from a bullish structure into a clear bearish phase after forming a Break of Structure (BOS) at the highs, followed by a Market Structure Shift (MSS) and a confirmed Change of Character (CHoCH).
Price is currently trending downward within a controlled bearish channel, respecting lower highs and lower lows.
🔍 Key Zones to Watch:
Sell Zone (Premium Area):
The marked iFVG (Inverse Fair Value Gap) aligned with the Order Block (OB) above current price remains a strong resistance zone.
Any pullback into this area is likely to offer sell opportunities.
Buy Zone (Discount Area):
Price is currently reacting from a Buy Order Block (OB) sitting within a strong support zone.
This area may produce a short-term bounce, but it remains a counter-trend move unless structure shifts.
📉 Scenario Outlook:
Bearish Continuation (Primary Bias):
If price fails to break above the sell OB / iFVG zone, expect continuation downward targeting:
Immediate support
Then lower support zone (small support area)
Bullish Pullback (Secondary Scenario):
A reaction from the current support could push price back into the premium zone (sell OB), where sellers are expected to step in again.
⚠️ Key Insight:
The overall structure remains bearish, and buy positions should be treated as short-term unless a new bullish BOS forms.
The Quantum Trading Mastery
註釋
Perfect Setup, Chasing the line marked交易進行
交易結束:目標達成
Wow, this chart was shared on 4th May and what a fantastic and perfect Trade Opportunity it was. Congratulations to those who didn't miss it. Price is back to the Support Zone. and broken BUY OB level and Support level. Its time for lower targets, the green arrow is marked for lower levels. 
免責聲明
這些資訊和出版物並非旨在提供,也不構成TradingView提供或認可的任何形式的財務、投資、交易或其他類型的建議或推薦。請閱讀使用條款以了解更多資訊。