
Hi friends.
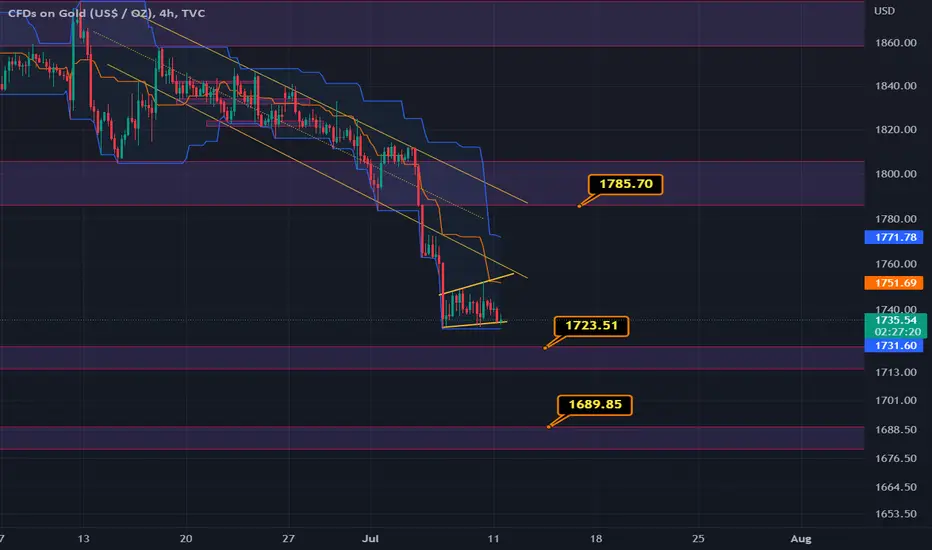
we are in a range area between two divergent lines that i show on my chart.
if we break this pattern down we see lower levels 1723 and if we loss this level too
we see 1690.
but if this pattern breakout up this means maybe we have a Retest to 1785 level
and after that maybe again falling.
this levels that i illustrate have an overlap with upper and lower bands of Donchian channel
so they are very important levels.
so we can wait till this pattern ends and price direction appear.
we are in a range area between two divergent lines that i show on my chart.
if we break this pattern down we see lower levels 1723 and if we loss this level too
we see 1690.
but if this pattern breakout up this means maybe we have a Retest to 1785 level
and after that maybe again falling.
this levels that i illustrate have an overlap with upper and lower bands of Donchian channel
so they are very important levels.
so we can wait till this pattern ends and price direction appear.
交易進行
we break down the pattern and touch first level at 1723.now we are near second target 1690!
交易結束:目標達成
first target reached 1723交易結束:目標達成
second target reached at 1689
免責聲明
這些資訊和出版物並非旨在提供,也不構成TradingView提供或認可的任何形式的財務、投資、交易或其他類型的建議或推薦。請閱讀使用條款以了解更多資訊。
免責聲明
這些資訊和出版物並非旨在提供,也不構成TradingView提供或認可的任何形式的財務、投資、交易或其他類型的建議或推薦。請閱讀使用條款以了解更多資訊。