
GOLD — Long-Term Cycle Compression Model
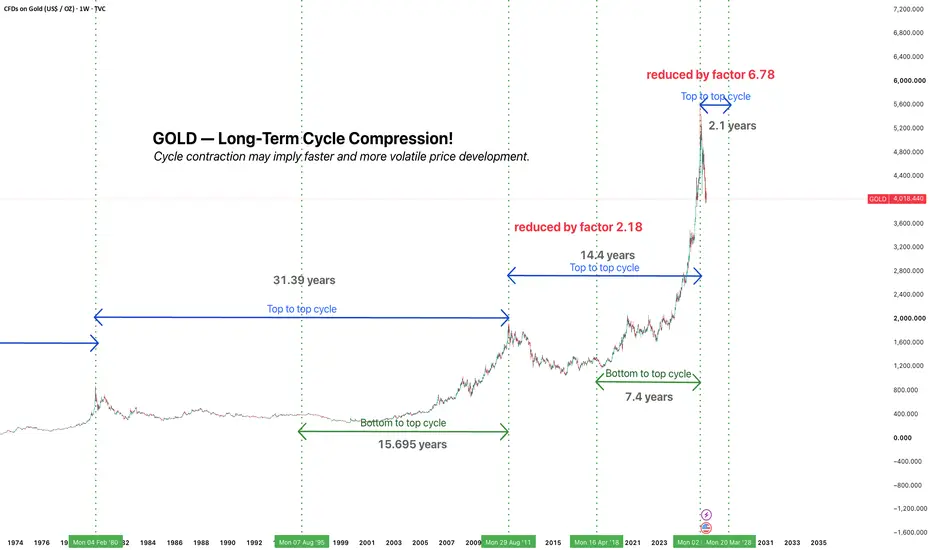
This chart examines the hypothesis that Gold’s major long-term market cycles are contracting over time.
The major top-to-top interval from the 1980 peak to the 2011 peak measured approximately 31.4 years. The subsequent interval from the 2011 peak to the proposed 2026 cycle high measured approximately 14.4 years, representing a contraction factor of roughly 2.18.
The contraction ratio can vary. Assuming compression at 6.7 factor the next cycle will be much faster and volalite completing in 2.1 years.
The bottom-to-top phases also appear to be shortening, supporting the broader cycle-compression hypothesis.
Disclaimer! The projection does not guarantee that Gold will form a market top on an exact date. It should be treated as a long-term timing framework and confirmed using price structure, momentum, volatility, real yields, US-dollar behavior, monetary policy and macroeconomic conditions.
This chart examines the hypothesis that Gold’s major long-term market cycles are contracting over time.
The major top-to-top interval from the 1980 peak to the 2011 peak measured approximately 31.4 years. The subsequent interval from the 2011 peak to the proposed 2026 cycle high measured approximately 14.4 years, representing a contraction factor of roughly 2.18.
The contraction ratio can vary. Assuming compression at 6.7 factor the next cycle will be much faster and volalite completing in 2.1 years.
The bottom-to-top phases also appear to be shortening, supporting the broader cycle-compression hypothesis.
Disclaimer! The projection does not guarantee that Gold will form a market top on an exact date. It should be treated as a long-term timing framework and confirmed using price structure, momentum, volatility, real yields, US-dollar behavior, monetary policy and macroeconomic conditions.

免責聲明
這些資訊和出版物並非旨在提供,也不構成TradingView提供或認可的任何形式的財務、投資、交易或其他類型的建議或推薦。請閱讀使用條款以了解更多資訊。
免責聲明
這些資訊和出版物並非旨在提供,也不構成TradingView提供或認可的任何形式的財務、投資、交易或其他類型的建議或推薦。請閱讀使用條款以了解更多資訊。