
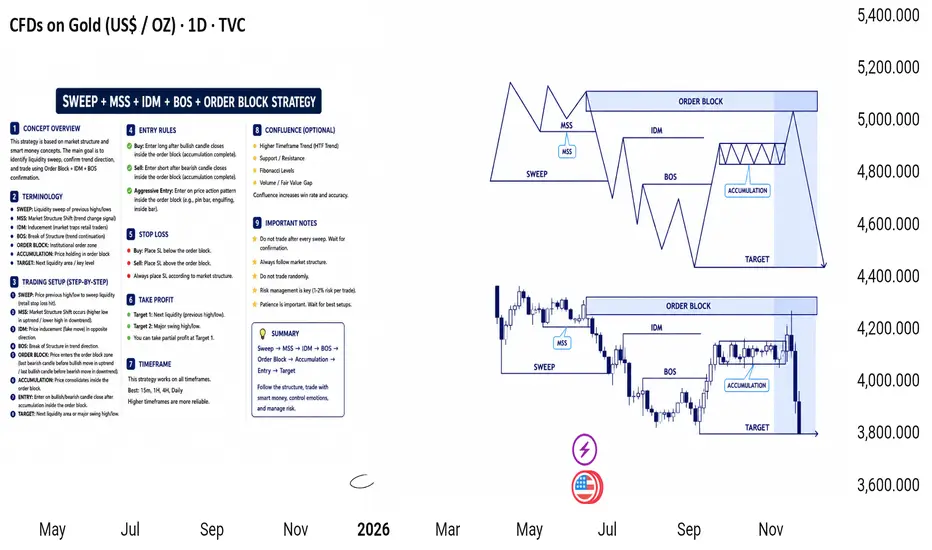
This chart presents an educational market structure analysis on Gold (XAUUSD) using a combination of liquidity sweep, market structure shift (MSS), break of structure (BOS), internal dealing range (IDM), and order block concepts. The idea shown here is designed to explain how price may react around key zones based on historical structure and institutional trading behavior. This analysis is shared strictly for educational and learning purposes and should not be interpreted as financial advice.
From the chart perspective, price initially appears to create a liquidity sweep, where previous highs or lows are briefly taken before the market changes direction. In many market conditions, this type of movement can represent a temporary liquidity grab as price moves beyond an obvious level and then reverses. Traders who study price action often observe these areas to better understand how momentum may shift after liquidity is collected.
Following the sweep, the chart highlights a Market Structure Shift (MSS), which may indicate a potential transition in short-term market direction. A structure shift generally occurs when price stops respecting the previous trend and begins creating movement in the opposite direction. This is often monitored as a possible sign that momentum could be weakening or changing.
After the MSS, the analysis identifies a Break of Structure (BOS). In technical analysis, a BOS is commonly used to observe whether the market is continuing in a newly formed direction. When structure breaks in alignment with momentum, traders sometimes use it as additional confirmation rather than relying on a single signal alone.
The highlighted Order Block zone in this chart represents an area where price previously showed strong reaction or imbalance. Some traders view these zones as areas of interest where price may revisit before continuing a move. However, no zone guarantees a reaction, and price behavior can remain unpredictable depending on market conditions, volatility, and external economic events.
The chart also references an accumulation/consolidation phase, where price temporarily moves sideways before a stronger directional move develops. Consolidation areas may reflect uncertainty, reduced momentum, or preparation for expansion in volatility. Observing how price reacts near these zones can help improve understanding of market behavior.
An important educational takeaway from this setup is the importance of confirmation and patience. Rather than reacting emotionally to every move, traders often wait for structure confirmation, candle closes, or additional confluence before forming a market bias. Risk management remains one of the most important aspects of trading, regardless of how strong a setup may appear.
Key educational concepts shown in this chart include:
• Liquidity Sweep – observing areas where previous highs/lows are taken.
• MSS (Market Structure Shift) – identifying a possible change in momentum.
• BOS (Break of Structure) – monitoring continuation or confirmation of movement.
• Order Block – recognizing areas of historical institutional interest.
• Accumulation – understanding periods of consolidation before expansion.
This chart should be viewed as a technical learning example of market structure and price action concepts. Markets are dynamic, and outcomes are never guaranteed. Every trader should conduct independent analysis, use proper risk management, and consider multiple confirmations before making any trading decision.
Educational Purpose Only — This analysis reflects a technical interpretation of price action and market structure and is not financial or investment advice.
From the chart perspective, price initially appears to create a liquidity sweep, where previous highs or lows are briefly taken before the market changes direction. In many market conditions, this type of movement can represent a temporary liquidity grab as price moves beyond an obvious level and then reverses. Traders who study price action often observe these areas to better understand how momentum may shift after liquidity is collected.
Following the sweep, the chart highlights a Market Structure Shift (MSS), which may indicate a potential transition in short-term market direction. A structure shift generally occurs when price stops respecting the previous trend and begins creating movement in the opposite direction. This is often monitored as a possible sign that momentum could be weakening or changing.
After the MSS, the analysis identifies a Break of Structure (BOS). In technical analysis, a BOS is commonly used to observe whether the market is continuing in a newly formed direction. When structure breaks in alignment with momentum, traders sometimes use it as additional confirmation rather than relying on a single signal alone.
The highlighted Order Block zone in this chart represents an area where price previously showed strong reaction or imbalance. Some traders view these zones as areas of interest where price may revisit before continuing a move. However, no zone guarantees a reaction, and price behavior can remain unpredictable depending on market conditions, volatility, and external economic events.
The chart also references an accumulation/consolidation phase, where price temporarily moves sideways before a stronger directional move develops. Consolidation areas may reflect uncertainty, reduced momentum, or preparation for expansion in volatility. Observing how price reacts near these zones can help improve understanding of market behavior.
An important educational takeaway from this setup is the importance of confirmation and patience. Rather than reacting emotionally to every move, traders often wait for structure confirmation, candle closes, or additional confluence before forming a market bias. Risk management remains one of the most important aspects of trading, regardless of how strong a setup may appear.
Key educational concepts shown in this chart include:
• Liquidity Sweep – observing areas where previous highs/lows are taken.
• MSS (Market Structure Shift) – identifying a possible change in momentum.
• BOS (Break of Structure) – monitoring continuation or confirmation of movement.
• Order Block – recognizing areas of historical institutional interest.
• Accumulation – understanding periods of consolidation before expansion.
This chart should be viewed as a technical learning example of market structure and price action concepts. Markets are dynamic, and outcomes are never guaranteed. Every trader should conduct independent analysis, use proper risk management, and consider multiple confirmations before making any trading decision.
Educational Purpose Only — This analysis reflects a technical interpretation of price action and market structure and is not financial or investment advice.

相關出版品
免責聲明
這些資訊和出版物並非旨在提供,也不構成TradingView提供或認可的任何形式的財務、投資、交易或其他類型的建議或推薦。請閱讀使用條款以了解更多資訊。