
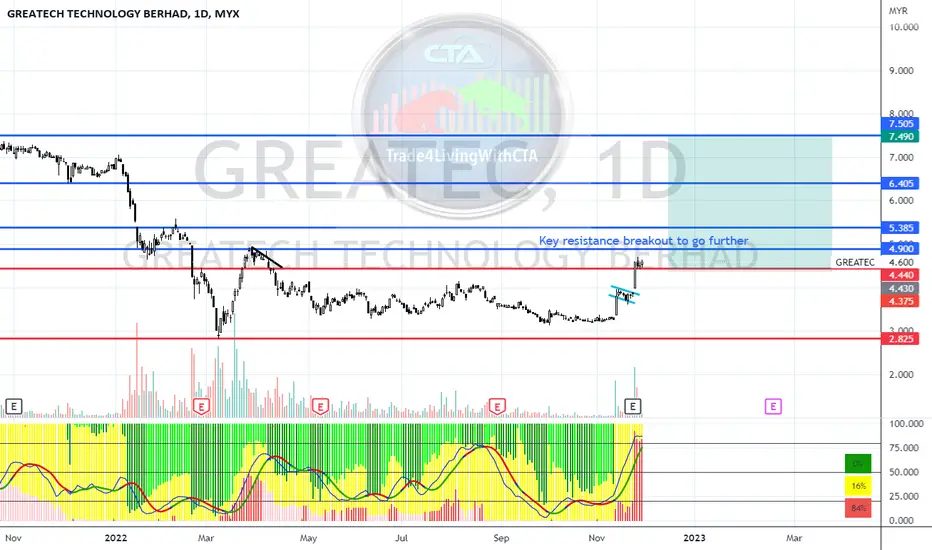
How to view the guidance via chart ( Refer back to pin message guidance if to trade )
Red Line = Support
Blue Line = Resistance
Light Blue = bullish/bearish pattern
Arrow = Double/Trip top/bottom
Red Chip = $$
Green Chip = XX
Red Line = Support
Blue Line = Resistance
Light Blue = bullish/bearish pattern
Arrow = Double/Trip top/bottom
Red Chip = $$
Green Chip = XX
註釋
Greatec already run more than 57% ROI from bottom. I believe there will be a retracement at 5.4 to 5.5 before it can start to run high again.註釋
As what I predicted. Retracing back after hit resistance area. Be patient & try to collect back at support area once it rebounded. Else gone my RM200k Profit haha.註釋
Technology index had hit resistance with a shooting star candle form. Aware if individual are still holding.交易進行
Incoming next wave coming. Monitor technology sector.
免責聲明
這些資訊和出版物並非旨在提供,也不構成TradingView提供或認可的任何形式的財務、投資、交易或其他類型的建議或推薦。請閱讀使用條款以了解更多資訊。