
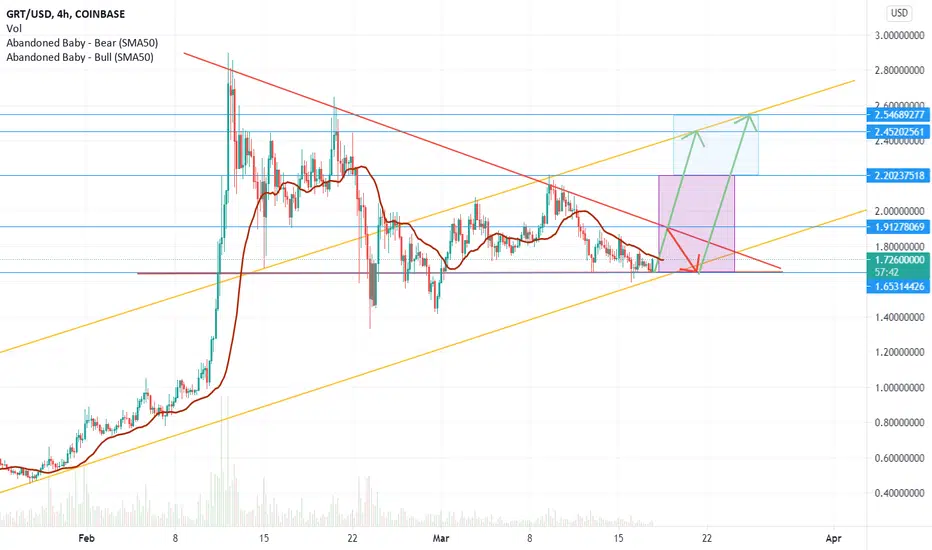
The graph has been consolidating in this bullish flag for almost an entire month. Two possible scenarios could playout:
First: GRT could bounce off the top trendline of the flag at $1.91 descending back to $1.65 price range, which has shown very strong support, before breaking out and uptrending to $2.54 price
Second: It bust through the top trend line passing $1.91 then on to retest $2.20 before ending up at the $2.45 TP
First: GRT could bounce off the top trendline of the flag at $1.91 descending back to $1.65 price range, which has shown very strong support, before breaking out and uptrending to $2.54 price
Second: It bust through the top trend line passing $1.91 then on to retest $2.20 before ending up at the $2.45 TP

免責聲明
這些資訊和出版物並非旨在提供,也不構成TradingView提供或認可的任何形式的財務、投資、交易或其他類型的建議或推薦。請閱讀使用條款以了解更多資訊。