The Graph: Updated
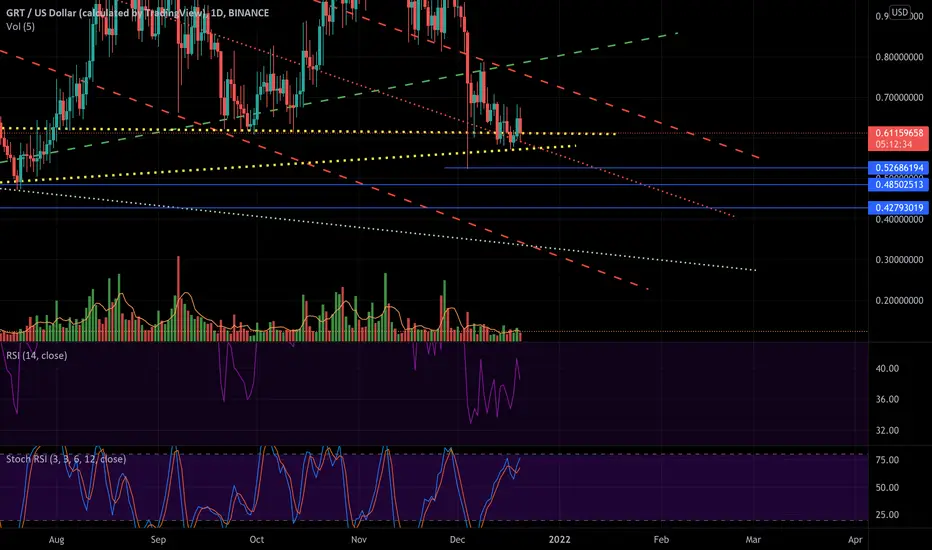
I should have included price levels from previous sell-offs earlier this year (horizontal Blue lines). Original post linked below.
It’s interesting to note that these Blue lines fro previous sell-off intersect our trend-channel early next year. We’ll see if they actually have a “tale” to tell (at the “tail” of the channel) or not (in which case, they’re just a bunch of lines).
It’s interesting to note that these Blue lines fro previous sell-off intersect our trend-channel early next year. We’ll see if they actually have a “tale” to tell (at the “tail” of the channel) or not (in which case, they’re just a bunch of lines).

免責聲明
這些資訊和出版物並非旨在提供,也不構成TradingView提供或認可的任何形式的財務、投資、交易或其他類型的建議或推薦。請閱讀使用條款以了解更多資訊。