GRVT: Vertical Rally Tests Local High Resistance – Counter-Trend Short Setup Offers Ultra-Tight Stop-Loss
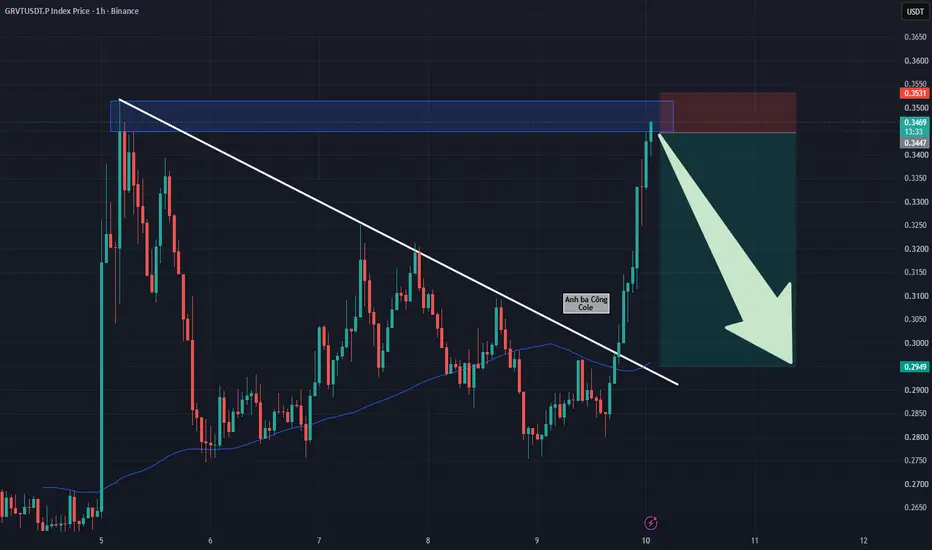
GRVT has registered an aggressive vertical price expansion, breaking cleanly above its macro descending trendline to surge directly into its previous swing-high resistance zone without executing a single technical relief pullback. However, according to textbook market mechanics, a vertical rally lacking interim consolidation phases leaves buyers vulnerable to momentum exhaustion and sudden profit-taking.
Based on the visual data from the 1-hour chart , this parabolic move has brought price action directly into the heavy $0.350 resistance ceiling. The rapid price expansion has stretched market structure, creating a significant void above underlying support floors. The market currently requires a healthy technical pullback to re-accumulate liquidity before sustaining higher trajectory goals.
Although this represents a short-term counter-trend strategy, the technical environment delivers a compelling Short setup. Traders can initiate Short positions around this overhead resistance barrier, establishing an exceptionally tight stop-loss parameter directly above the $0.353 mark. The strategic take-profit target aims for the $0.300 psychological round-number support baseline, confluent with the retest junction of the broken trendline and the dynamic MA100 line.
Disclaimer: This is not financial advice, DYOR.
GRVT has registered an aggressive vertical price expansion, breaking cleanly above its macro descending trendline to surge directly into its previous swing-high resistance zone without executing a single technical relief pullback. However, according to textbook market mechanics, a vertical rally lacking interim consolidation phases leaves buyers vulnerable to momentum exhaustion and sudden profit-taking.
Based on the visual data from the 1-hour chart , this parabolic move has brought price action directly into the heavy $0.350 resistance ceiling. The rapid price expansion has stretched market structure, creating a significant void above underlying support floors. The market currently requires a healthy technical pullback to re-accumulate liquidity before sustaining higher trajectory goals.
Although this represents a short-term counter-trend strategy, the technical environment delivers a compelling Short setup. Traders can initiate Short positions around this overhead resistance barrier, establishing an exceptionally tight stop-loss parameter directly above the $0.353 mark. The strategic take-profit target aims for the $0.300 psychological round-number support baseline, confluent with the retest junction of the broken trendline and the dynamic MA100 line.
Disclaimer: This is not financial advice, DYOR.

免責聲明
這些資訊和出版物並非旨在提供,也不構成TradingView提供或認可的任何形式的財務、投資、交易或其他類型的建議或推薦。請閱讀使用條款以了解更多資訊。
免責聲明
這些資訊和出版物並非旨在提供,也不構成TradingView提供或認可的任何形式的財務、投資、交易或其他類型的建議或推薦。請閱讀使用條款以了解更多資訊。