
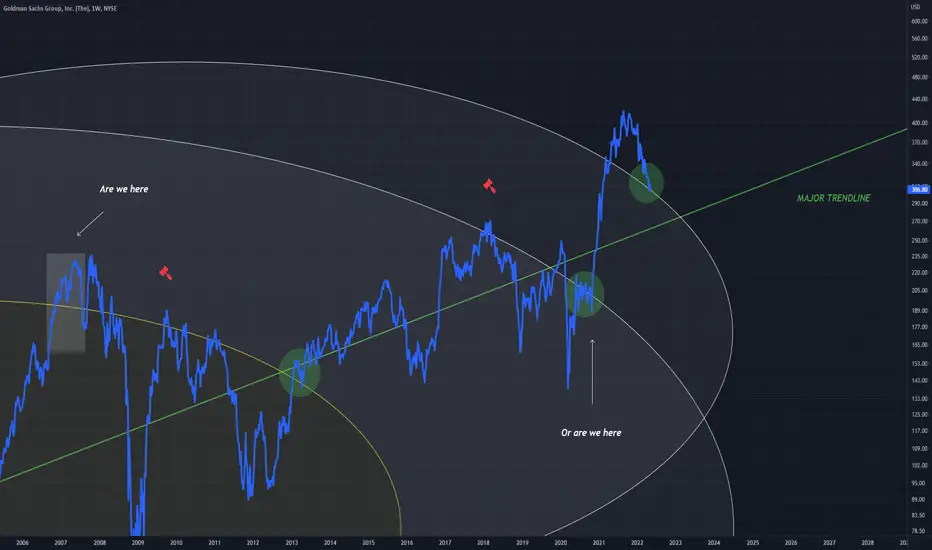
There are two positions we are either in
The white rectangle which is the beginning of a rejection pattern along the circle, or a green circle which is a bullish pattern that finds support on the circle
I am leaning more towards the green circle position (bullish state) due to the position price being quite highly above the circle and it is more comparable to the green circle on the yellow fib ring
Being above the green trend line adds to this bullish assumption
This is the Weekly chart for GS (Goldman Sachs)
The white rectangle which is the beginning of a rejection pattern along the circle, or a green circle which is a bullish pattern that finds support on the circle
I am leaning more towards the green circle position (bullish state) due to the position price being quite highly above the circle and it is more comparable to the green circle on the yellow fib ring
Being above the green trend line adds to this bullish assumption
This is the Weekly chart for GS (Goldman Sachs)

免責聲明
這些資訊和出版物並非旨在提供,也不構成TradingView提供或認可的任何形式的財務、投資、交易或其他類型的建議或推薦。請閱讀使用條款以了解更多資訊。