
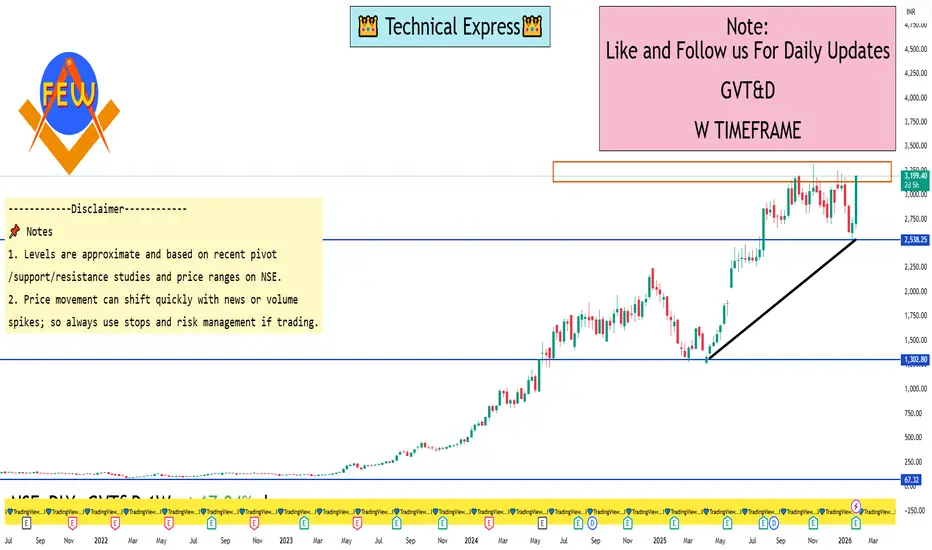
📊 Current context (end-Jan 2026):
The stock is trading near ₹3,100-₹3,200 levels recently.
📈 Resistance Levels (Upside Targets)
1. ~₹3,170 – ₹3,200
– Near recent intraday highs and short-term caps on rallies.
2. ~₹3,250 – ₹3,324
– Approaching the 52-week high zone (~₹3,323.8).
3. ~₹3,350 +
– Above the prior yearly highs — next structural resistance if breakout confirmed.
📉 Support Levels (Downside Floors)
1. ~₹2,670 – ₹2,680
– First solid support zone from pivot analyses & moving averages.
2. ~₹2,600 – ₹2,610
– Secondary support around longer-term EMA levels / 200-day average and prior consolidations.
3. ~₹2,520 – ₹2,550
– Lower support in case of deeper correction — near the 1-week recent low zone.
🔄 Pivot & Momentum Signals
Technical tools (e.g., trading platforms) suggest mixed/neutral to moderately bullish momentum in the 1-week context, with some indicators leaning positive but others neutral.
The stock is trading near ₹3,100-₹3,200 levels recently.
📈 Resistance Levels (Upside Targets)
1. ~₹3,170 – ₹3,200
– Near recent intraday highs and short-term caps on rallies.
2. ~₹3,250 – ₹3,324
– Approaching the 52-week high zone (~₹3,323.8).
3. ~₹3,350 +
– Above the prior yearly highs — next structural resistance if breakout confirmed.
📉 Support Levels (Downside Floors)
1. ~₹2,670 – ₹2,680
– First solid support zone from pivot analyses & moving averages.
2. ~₹2,600 – ₹2,610
– Secondary support around longer-term EMA levels / 200-day average and prior consolidations.
3. ~₹2,520 – ₹2,550
– Lower support in case of deeper correction — near the 1-week recent low zone.
🔄 Pivot & Momentum Signals
Technical tools (e.g., trading platforms) suggest mixed/neutral to moderately bullish momentum in the 1-week context, with some indicators leaning positive but others neutral.

相關出版品
免責聲明
這些資訊和出版物並非旨在提供,也不構成TradingView提供或認可的任何形式的財務、投資、交易或其他類型的建議或推薦。請閱讀使用條款以了解更多資訊。