
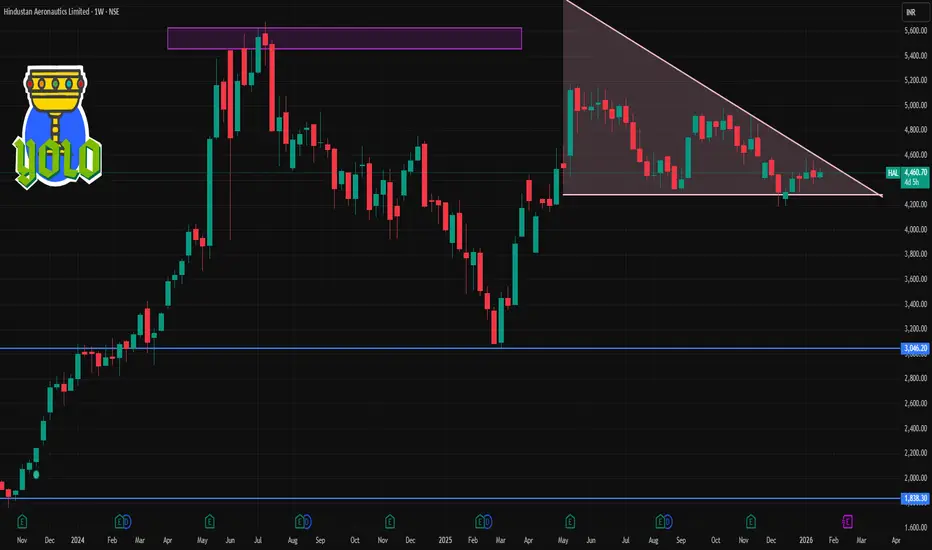
📌 Current Approximate Price
HAL’s latest price is around ₹4,440 – ₹4,480 on NSE (varies with live market moves).
📊 Weekly Technical Levels (1‑Week View)
📈 Resistance Levels (Upside)
These are levels where price may struggle to break above on the weekly timeframe:
R1 (Immediate): ~₹4,500 – ₹4,550 — first resistance zone.
R2 (Medium): ~₹4,540 – ₹4,580 — next resistance cluster.
R3 (Bullish / extended): ~₹4,580 – ₹4,670 — higher resistance if buyers take control.
Key breakout barrier to watch: sustaining above ₹4,580–₹4,600 may strengthen bullish bias for the week.
📉 Support Levels (Downside)
These are levels where price may find buying interest if it declines:
S1 (Immediate): ~₹4,420 – ₹4,380 — first support for this week.
S2 (Secondary): ~₹4,380 – ₹4,340 — deeper support if sellers push lower.
S3 (Lower): ~₹4,340 – ₹4,300 — key demand zone historically.
Key downside pivot: break below ~₹4,380 could extend selling into the ₹4,300 area.
📐 Weekly Pivot Reference
Pivot Point: ~₹4,460 – ₹4,470 — midpoint reference level for direction bias.
Above this pivot → bullish bias
Below this pivot → bearish/neutral bias
📝 Summary Weekly Levels Table
Level Price Zone
🟥 R3 ~₹4,580 – ₹4,670
🟧 R2 ~₹4,540 – ₹4,580
🟨 R1 ~₹4,500 – ₹4,550
⚪ Pivot ~₹4,460 – ₹4,470
🟦 S1 ~₹4,420 – ₹4,380
🟩 S2 ~₹4,380 – ₹4,340
🟪 S3 ~₹4,340 – ₹4,300

Contact Knowledgehub for a detailed consultation: Dm on WhatsApp: [wa.link/a2o0kz]-
Phone No: [+91 93102 26243]-
Email: [tradingviewknowledgehub@gmail.com]---
-- Let’s achieve success together!
Phone No: [+91 93102 26243]-
Email: [tradingviewknowledgehub@gmail.com]---
-- Let’s achieve success together!
相關出版品
免責聲明
這些資訊和出版物並非旨在提供,也不構成TradingView提供或認可的任何形式的財務、投資、交易或其他類型的建議或推薦。請閱讀使用條款以了解更多資訊。