做多
HAPI Bottomed?
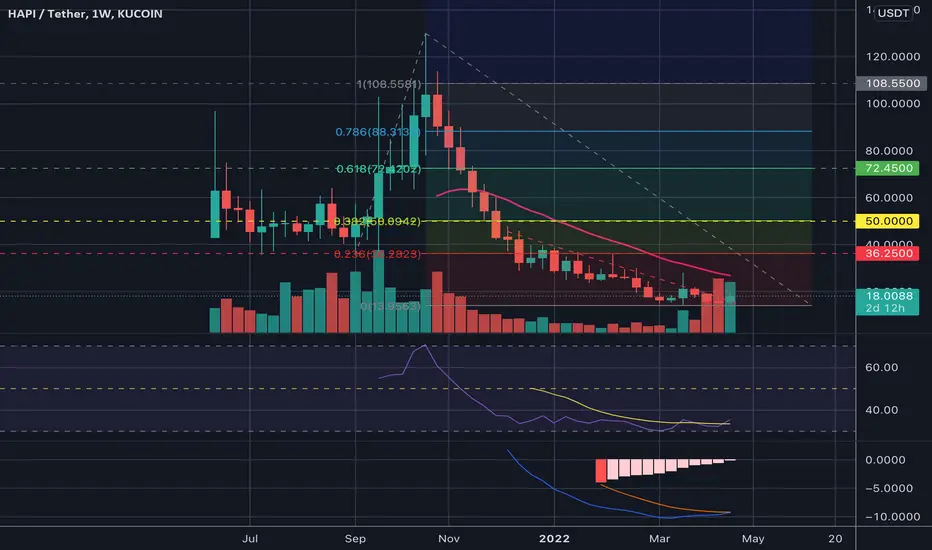
HAPI/USD (Weekly)
- Seem to have found Support at approx. the $15-16 area and range-bound for a while.
- MACD/Signal and Histogram reversing
- Volume increasing over the last 3 weeks
- RSI low reversing
- Looks to be closing above the 50MA on the daily
- Resistance levels marked out by the fib extension (String Resistance will be at $50 and approx $72 area. If we can break above with strength, we should be forming a new high.
- Strong Resistance at the $50 level shown by the Volume Profile
- Seem to have found Support at approx. the $15-16 area and range-bound for a while.
- MACD/Signal and Histogram reversing
- Volume increasing over the last 3 weeks
- RSI low reversing
- Looks to be closing above the 50MA on the daily
- Resistance levels marked out by the fib extension (String Resistance will be at $50 and approx $72 area. If we can break above with strength, we should be forming a new high.
- Strong Resistance at the $50 level shown by the Volume Profile

免責聲明
這些資訊和出版物並非旨在提供,也不構成TradingView提供或認可的任何形式的財務、投資、交易或其他類型的建議或推薦。請閱讀使用條款以了解更多資訊。
免責聲明
這些資訊和出版物並非旨在提供,也不構成TradingView提供或認可的任何形式的財務、投資、交易或其他類型的建議或推薦。請閱讀使用條款以了解更多資訊。