
I've been following HBAR since early 2020 when it dipped below 1 cent briefly and then took off.
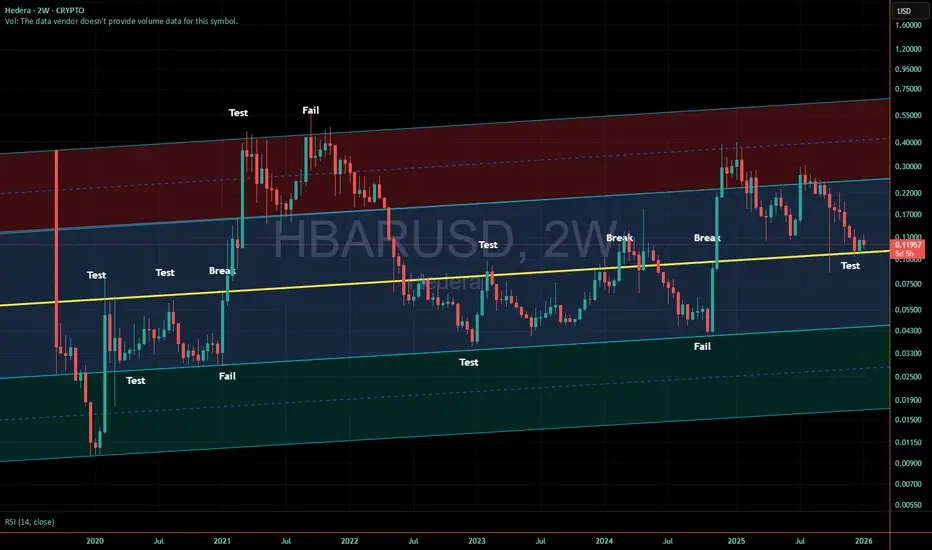
This chart is simply to show key areas of support and resistance it has been testing that are on a parallel vs the traditional horizontal S/R.
At this point, if it loses the 12 cent area around the yellow line, I'd expect a test somewhere near 4.5 cents. If that test fails to break through into the green or gets quickly bought up, it may be the last low we see in a while.
On the other hand, if the Bitcoin market drops hard affecting all crypto look to see if we see yet another move into the green box.
This chart is simply to show key areas of support and resistance it has been testing that are on a parallel vs the traditional horizontal S/R.
At this point, if it loses the 12 cent area around the yellow line, I'd expect a test somewhere near 4.5 cents. If that test fails to break through into the green or gets quickly bought up, it may be the last low we see in a while.
On the other hand, if the Bitcoin market drops hard affecting all crypto look to see if we see yet another move into the green box.

免責聲明
這些資訊和出版物並非旨在提供,也不構成TradingView提供或認可的任何形式的財務、投資、交易或其他類型的建議或推薦。請閱讀使用條款以了解更多資訊。
免責聲明
這些資訊和出版物並非旨在提供,也不構成TradingView提供或認可的任何形式的財務、投資、交易或其他類型的建議或推薦。請閱讀使用條款以了解更多資訊。