
⏳ Spot
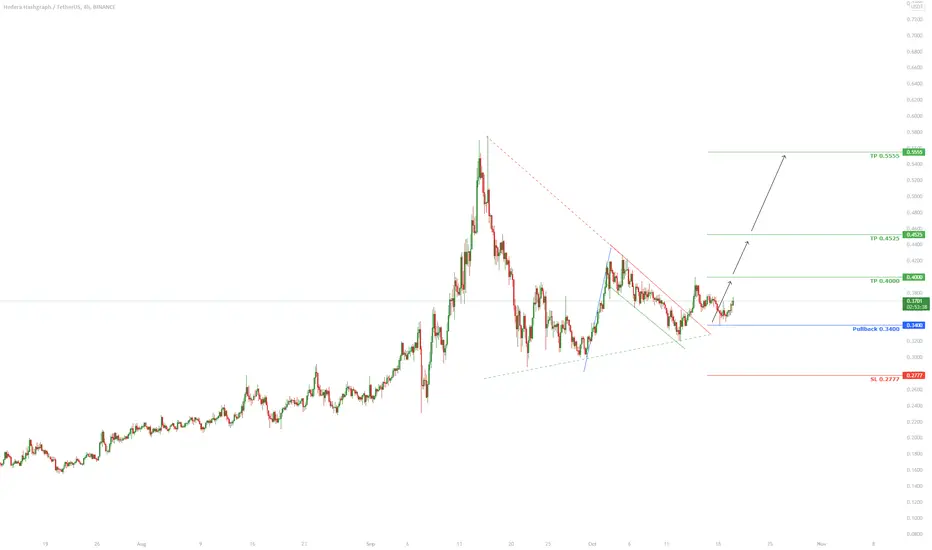
💎 HBARUSDT has formed a symmetrical triangle, and it has also formed a Bullish flag . After the breakout it might go lower to the Pullback zone and then It continues to go higher.
🌐 Tradingview
🏁 Short & Medium Term
💵 Invest Only 5% of your Portfolio
🎳 Entry at Market or at 0.3400
☕️ TP1 0.4000
🍺 TP2 0.4525
🍻 TP3 0.5555
🍾 TP4 ______
🍷 TP5 ______
🍸 TP6 ______
🍹 TP7 ______
🎁 TP8 ______
🚫 SL 0.2777
Good Luck 🎲
Check the Links in Description and If you LIKE this analysis, Please support our page and Ideas by hitting the LIKE 👍 button. ❤️ Your Support is really appreciated! ❤️
Traders, if you have your own opinion about it, please write your own in the comment box. We will be glad for this.
Feel free to request any pair/instrument analysis or ask any questions in the comment section below.
We will have more FREE forecasts in TradingView soon
Have a Profitable Day

免責聲明
這些資訊和出版物並非旨在提供,也不構成TradingView提供或認可的任何形式的財務、投資、交易或其他類型的建議或推薦。請閱讀使用條款以了解更多資訊。
免責聲明
這些資訊和出版物並非旨在提供,也不構成TradingView提供或認可的任何形式的財務、投資、交易或其他類型的建議或推薦。請閱讀使用條款以了解更多資訊。