
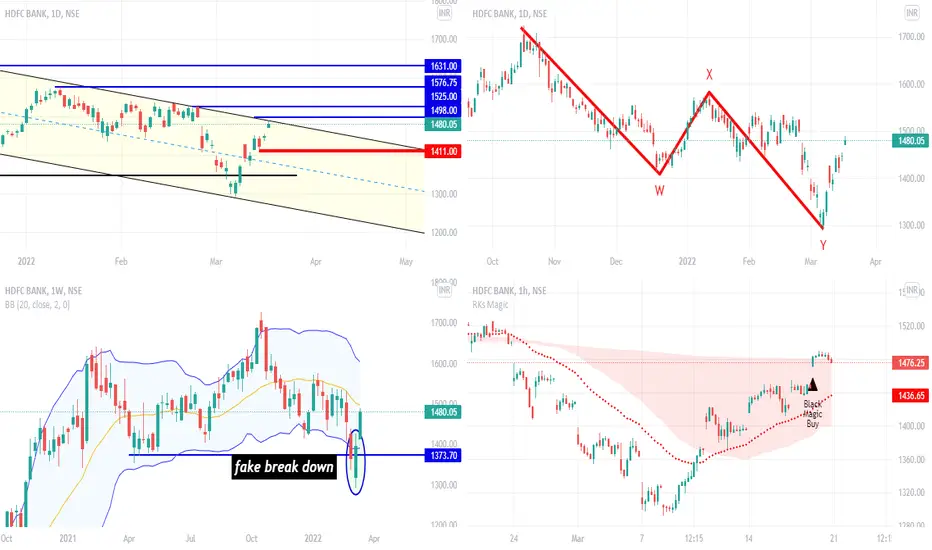
This stock is showing good power and strength to go more upside, once price closes above 1497 plus levels, then it can show more strength to go further up side,
Bullish crossover in weekly macd can put the bulls in a dominant position. on daily chart swing low of 1411 will be a crucial support to watch out for on the way down. One can go long at current levels or on dips near 1430 - 1450 zones (if any ) with stop of closing below 1411.

Fake break-down and now at parallel channel's top

wave structure could be like this

something coincides factors

macd in weekly is uptick

macd in daily is positive crossover and uptick

rsi in daily uptick along with double breakout

Disclaimer.
I am not sebi registered analyst.
My studies are for educational purpose only.
Please Consult your financial advisor before trading or investing.
I am not responsible for any kinds of your profits and your losses.
Bullish crossover in weekly macd can put the bulls in a dominant position. on daily chart swing low of 1411 will be a crucial support to watch out for on the way down. One can go long at current levels or on dips near 1430 - 1450 zones (if any ) with stop of closing below 1411.
Fake break-down and now at parallel channel's top
wave structure could be like this
something coincides factors
macd in weekly is uptick
macd in daily is positive crossover and uptick
rsi in daily uptick along with double breakout
Disclaimer.
I am not sebi registered analyst.
My studies are for educational purpose only.
Please Consult your financial advisor before trading or investing.
I am not responsible for any kinds of your profits and your losses.

YouTube: youtube.com/@rk_charts
Telegram : t.me/RK_Charts
Twitter : @charts_rk
Email : rkcharts@gmail. com
Disclaimer.
I am not sebi registered analyst.
My studies are for educational purpose only.
Telegram : t.me/RK_Charts
Twitter : @charts_rk
Email : rkcharts@gmail. com
Disclaimer.
I am not sebi registered analyst.
My studies are for educational purpose only.
相關出版品
免責聲明
這些資訊和出版物並非旨在提供,也不構成TradingView提供或認可的任何形式的財務、投資、交易或其他類型的建議或推薦。請閱讀使用條款以了解更多資訊。
YouTube: youtube.com/@rk_charts
Telegram : t.me/RK_Charts
Twitter : @charts_rk
Email : rkcharts@gmail. com
Disclaimer.
I am not sebi registered analyst.
My studies are for educational purpose only.
Telegram : t.me/RK_Charts
Twitter : @charts_rk
Email : rkcharts@gmail. com
Disclaimer.
I am not sebi registered analyst.
My studies are for educational purpose only.
相關出版品
免責聲明
這些資訊和出版物並非旨在提供,也不構成TradingView提供或認可的任何形式的財務、投資、交易或其他類型的建議或推薦。請閱讀使用條款以了解更多資訊。