
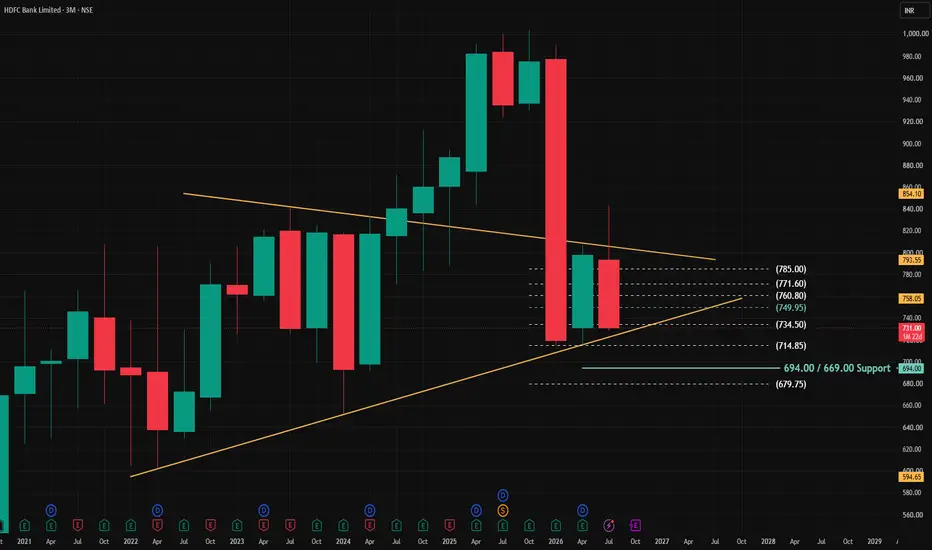
The Dominant Shift: The chart is anchored by a massive red (bearish) candle that aggressively snapped the preceding multi-month uptrend. This single candle signifies a massive influx of selling pressure and dictates the current longer-term bearish bias.
Triangle Consolidation: Following that dramatic drop, the price action has compressed into a symmetrical triangle or bearish pennant pattern. The asset is currently being squeezed between a descending resistance trendline and an ascending support trendline, indicating a standoff between buyers and sellers.
Recent Momentum: The most recent monthly candle is red, demonstrating that the bears are successfully defending the upper resistance bounds. The price is currently hovering near 734.50, placing intense pressure on the lower ascending trendline.
Critical Levels to Watch:
Immediate Support: The price is testing the bounds of the ascending trendline. If it breaks below the 714.85 level, it confirms a bearish breakdown of the triangle.
Major Structural Support: Below the current formation lies a massive, clearly defined historical support base in teal at the 694.00 to 669.00 zone. If the current triangle breaks to the downside, this is the primary target for sellers.
Upside Invalidation: For the bulls to regain control and invalidate the bearish continuation setup, they must force a definitive breakout above the descending trendline, specifically clearing the 785.00 resistance level.
Share Like & Follow
Triangle Consolidation: Following that dramatic drop, the price action has compressed into a symmetrical triangle or bearish pennant pattern. The asset is currently being squeezed between a descending resistance trendline and an ascending support trendline, indicating a standoff between buyers and sellers.
Recent Momentum: The most recent monthly candle is red, demonstrating that the bears are successfully defending the upper resistance bounds. The price is currently hovering near 734.50, placing intense pressure on the lower ascending trendline.
Critical Levels to Watch:
Immediate Support: The price is testing the bounds of the ascending trendline. If it breaks below the 714.85 level, it confirms a bearish breakdown of the triangle.
Major Structural Support: Below the current formation lies a massive, clearly defined historical support base in teal at the 694.00 to 669.00 zone. If the current triangle breaks to the downside, this is the primary target for sellers.
Upside Invalidation: For the bulls to regain control and invalidate the bearish continuation setup, they must force a definitive breakout above the descending trendline, specifically clearing the 785.00 resistance level.
Share Like & Follow
交易進行
On dot TL LOW...lets see near 694 levls on EOD basis

免責聲明
這些資訊和出版物並非旨在提供,也不構成TradingView提供或認可的任何形式的財務、投資、交易或其他類型的建議或推薦。請閱讀使用條款以了解更多資訊。