
01-12
Daily chart of HDFCBANK1!
LTP: 1638.25
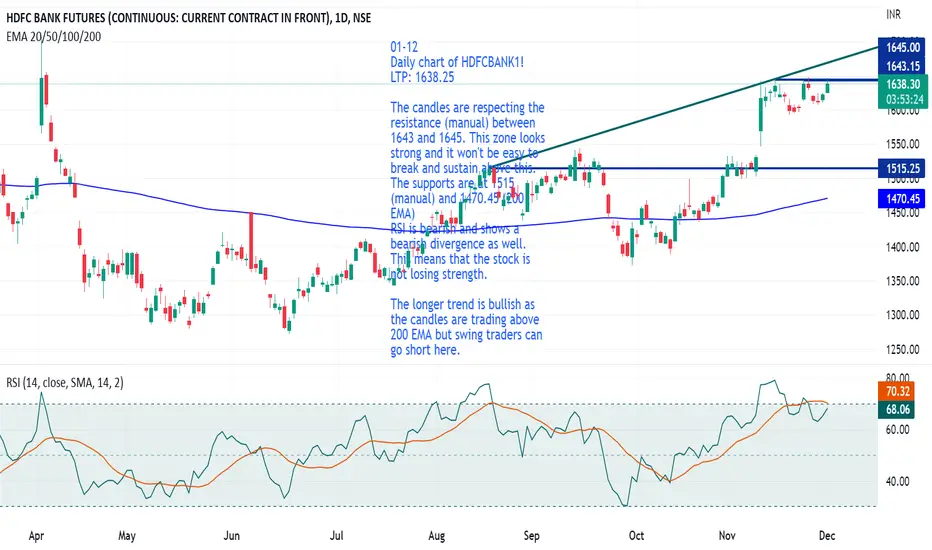
The candles are respecting the resistance (manual) between 1643 and 1645. This zone looks strong and it won't be easy to break and sustain above this.
The supports are at 1515 (manual) and 1470.45 (200 EMA)
RSI is bearish and shows a bearish divergence as well. This means that the stock is not losing strength.
The longer trend is bullish as the candles are trading above 200 EMA but swing traders can go short here.

免責聲明
這些資訊和出版物並非旨在提供,也不構成TradingView提供或認可的任何形式的財務、投資、交易或其他類型的建議或推薦。請閱讀使用條款以了解更多資訊。
免責聲明
這些資訊和出版物並非旨在提供,也不構成TradingView提供或認可的任何形式的財務、投資、交易或其他類型的建議或推薦。請閱讀使用條款以了解更多資訊。