
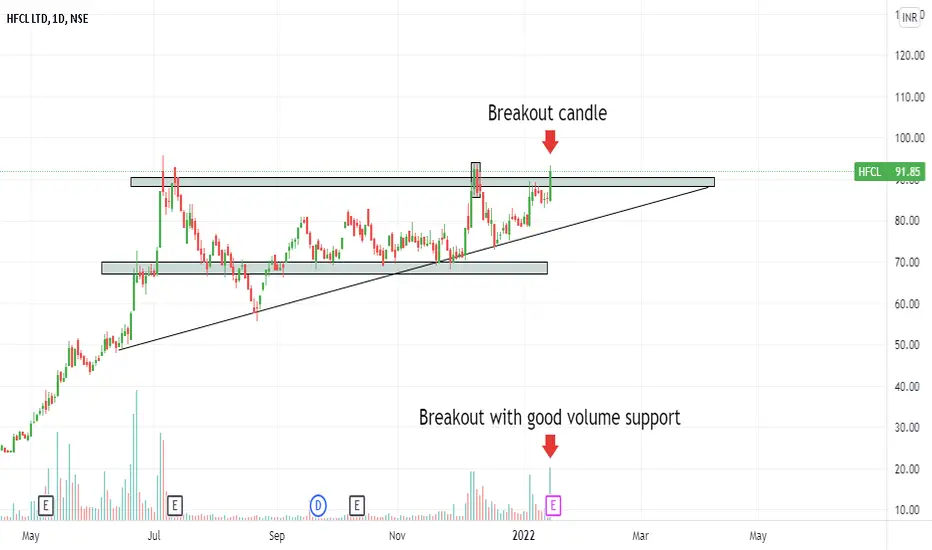
Here's the chart analysis of HFCL .
HFCL in an uptrend and it formed a Triangle Pattern breakout with a Good Volume support . In terms of the the pattern touches the Resistance zone and now gives a Breakout . after a breakout wait for a next move and price moves towards a upside .
HFCL in an uptrend and it formed a Triangle Pattern breakout with a Good Volume support . In terms of the the pattern touches the Resistance zone and now gives a Breakout . after a breakout wait for a next move and price moves towards a upside .

免責聲明
這些資訊和出版物並非旨在提供,也不構成TradingView提供或認可的任何形式的財務、投資、交易或其他類型的建議或推薦。請閱讀使用條款以了解更多資訊。
免責聲明
這些資訊和出版物並非旨在提供,也不構成TradingView提供或認可的任何形式的財務、投資、交易或其他類型的建議或推薦。請閱讀使用條款以了解更多資訊。