
📈 HFCL (HFCL Ltd.) — Technical Structure Analysis
Chart Visual & Pattern Layout: ChartsSpecialist (via TradingView)
🔍 Technical Observations
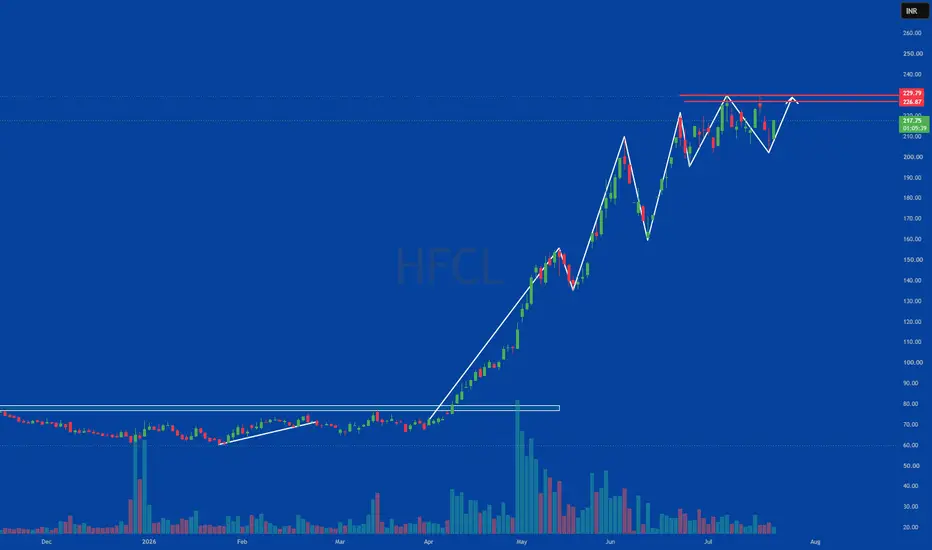
Accumulation Breakout: The chart highlights an initial breakout from a prolonged horizontal base consolidation zone, which initiated a sharp upward trend phase.
Double Top / Overhead Resistance: Dual horizontal red lines near the top mark a key supply region where price action has encountered repeated rejections after reaching peak swing levels.
Swing Dynamics & Trend Progression: White trend lines trace the multi-leg impulse advance, showing higher highs and higher lows before transitioning into wider consolidation near the resistance zone.
📚 Technical Analysis Concepts Demonstrated
Base Breakout & Expansion: Studying how long-term range contraction often precedes strong price expansion.
Double Top Pattern: Identifying classic reversal/resistance patterns formed when buyers fail to break above a prior swing high.
Market Waves & Cycles: Visualizing impulse moves and corrective retracements within a primary uptrend.
📌 SEBI Compliant Educational Disclaimer
Regulatory Disclaimer & Disclosures:
Educational Purpose Only: This post analyzes chart patterns and technical concepts strictly for learning and educational purposes.
No Recommendation: This content does NOT contain target levels, stop-loss triggers, entry calls, or buy/sell/hold recommendations.
SEBI Registration Status: ChartsSpecialist and the publisher are NOT SEBI-registered Research Analysts or Investment Advisors.
Risk Warning: Securities trading involves market risk. Past patterns do not guarantee future price movements. Please consult a qualified SEBI-registered financial advisor before taking any market positions.
#ChartsSpecialist #HFCL #TechnicalAnalysis #ChartReading #StockMarketEducation #SEBICompliant #PriceAction #TradingView #FinancialLiteracy #NSE #DoubleTop #Breakout
Chart Visual & Pattern Layout: ChartsSpecialist (via TradingView)
🔍 Technical Observations
Accumulation Breakout: The chart highlights an initial breakout from a prolonged horizontal base consolidation zone, which initiated a sharp upward trend phase.
Double Top / Overhead Resistance: Dual horizontal red lines near the top mark a key supply region where price action has encountered repeated rejections after reaching peak swing levels.
Swing Dynamics & Trend Progression: White trend lines trace the multi-leg impulse advance, showing higher highs and higher lows before transitioning into wider consolidation near the resistance zone.
📚 Technical Analysis Concepts Demonstrated
Base Breakout & Expansion: Studying how long-term range contraction often precedes strong price expansion.
Double Top Pattern: Identifying classic reversal/resistance patterns formed when buyers fail to break above a prior swing high.
Market Waves & Cycles: Visualizing impulse moves and corrective retracements within a primary uptrend.
📌 SEBI Compliant Educational Disclaimer
Regulatory Disclaimer & Disclosures:
Educational Purpose Only: This post analyzes chart patterns and technical concepts strictly for learning and educational purposes.
No Recommendation: This content does NOT contain target levels, stop-loss triggers, entry calls, or buy/sell/hold recommendations.
SEBI Registration Status: ChartsSpecialist and the publisher are NOT SEBI-registered Research Analysts or Investment Advisors.
Risk Warning: Securities trading involves market risk. Past patterns do not guarantee future price movements. Please consult a qualified SEBI-registered financial advisor before taking any market positions.
#ChartsSpecialist #HFCL #TechnicalAnalysis #ChartReading #StockMarketEducation #SEBICompliant #PriceAction #TradingView #FinancialLiteracy #NSE #DoubleTop #Breakout

免責聲明
這些資訊和出版物並非旨在提供,也不構成TradingView提供或認可的任何形式的財務、投資、交易或其他類型的建議或推薦。請閱讀使用條款以了解更多資訊。
免責聲明
這些資訊和出版物並非旨在提供,也不構成TradingView提供或認可的任何形式的財務、投資、交易或其他類型的建議或推薦。請閱讀使用條款以了解更多資訊。