
Technical:
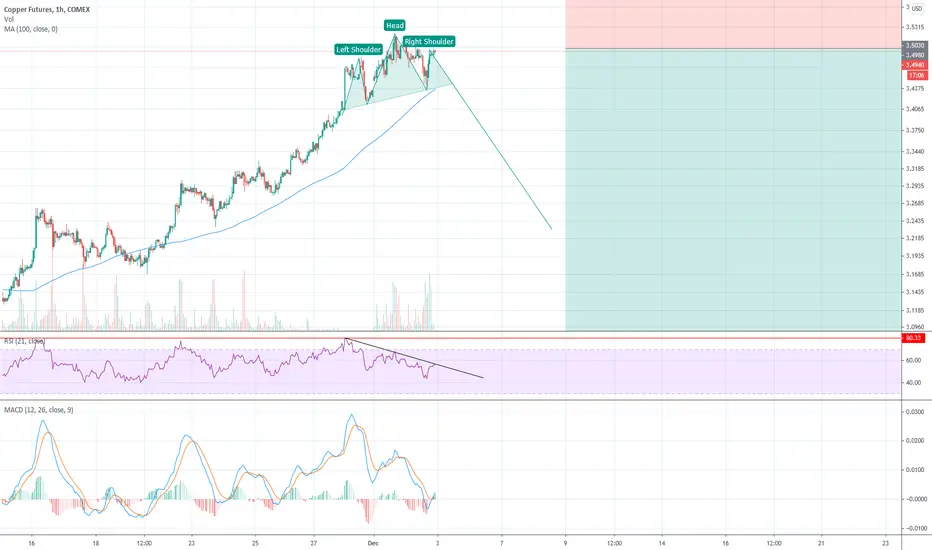
An hour precision chart indicates possible head and shoulder formation, negative RSI. Day precision chart indicates RSI almost at its 80s and if a divergence is to be build somewhere there is a high chance it is here.
Fundamental:
Low stockpile of copper in China has inspired a rally but at this level of stockpile ALWAYS in the past we have seen a move that rebuilds it fast within a month.
Take profit 2.5
It would be great to see gold retest 1850 from bottom and then all commodities could initiate a simultaneous correction. In the long term commodities (obviously not all of them) can only rise.
An hour precision chart indicates possible head and shoulder formation, negative RSI. Day precision chart indicates RSI almost at its 80s and if a divergence is to be build somewhere there is a high chance it is here.
Fundamental:
Low stockpile of copper in China has inspired a rally but at this level of stockpile ALWAYS in the past we have seen a move that rebuilds it fast within a month.
Take profit 2.5
It would be great to see gold retest 1850 from bottom and then all commodities could initiate a simultaneous correction. In the long term commodities (obviously not all of them) can only rise.

免責聲明
這些資訊和出版物並非旨在提供,也不構成TradingView提供或認可的任何形式的財務、投資、交易或其他類型的建議或推薦。請閱讀使用條款以了解更多資訊。
免責聲明
這些資訊和出版物並非旨在提供,也不構成TradingView提供或認可的任何形式的財務、投資、交易或其他類型的建議或推薦。請閱讀使用條款以了解更多資訊。