
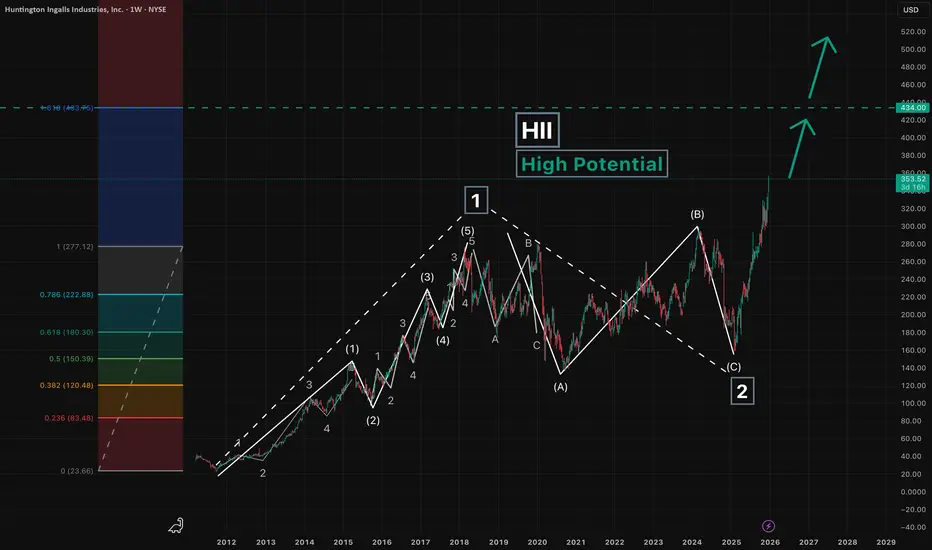
From early October 2011 to February 2018, Huntington Ingalls Industries was in a growth phase.
This was followed by a prolonged correction lasting from February 2018 to February 2025.
During this corrective phase, the price dropped by more than 50% and overlapped the sub-wave 1, confirming the completion of the move.
Since February 2025, Huntington Ingalls Industries has been showing an impulsive upward movement.
Based on these factors, it can be assumed that the large waves 1 and 2 have already been completed, and the HII chart is now developing wave 3.
Summary:
Significant upside potential remains in the long term.
In the next idea, we will take a closer look at the current impulsive move.
---
Please subscribe and leave a comment.
You’ll get new information faster than anyone else.
---
This was followed by a prolonged correction lasting from February 2018 to February 2025.
During this corrective phase, the price dropped by more than 50% and overlapped the sub-wave 1, confirming the completion of the move.
Since February 2025, Huntington Ingalls Industries has been showing an impulsive upward movement.
Based on these factors, it can be assumed that the large waves 1 and 2 have already been completed, and the HII chart is now developing wave 3.
Summary:
Significant upside potential remains in the long term.
In the next idea, we will take a closer look at the current impulsive move.
---
Please subscribe and leave a comment.
You’ll get new information faster than anyone else.
---

免責聲明
這些資訊和出版物並非旨在提供,也不構成TradingView提供或認可的任何形式的財務、投資、交易或其他類型的建議或推薦。請閱讀使用條款以了解更多資訊。
免責聲明
這些資訊和出版物並非旨在提供,也不構成TradingView提供或認可的任何形式的財務、投資、交易或其他類型的建議或推薦。請閱讀使用條款以了解更多資訊。