
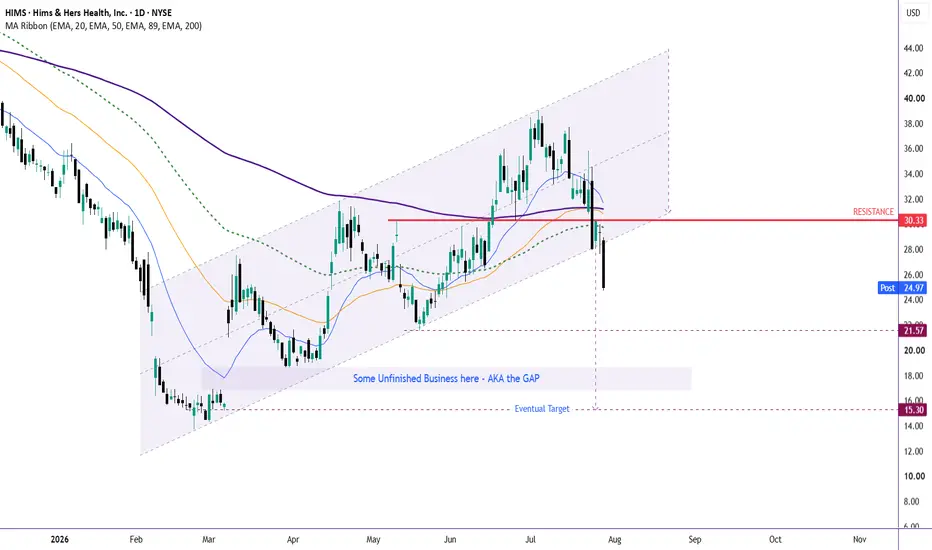
For several months, HIMS respected a well-defined rising channel, with buyers consistently stepping in at the lower boundary and driving higher highs.
That trend may now be changing.
Price has broken below the channel support, signaling that bullish momentum is fading and the market structure is weakening. Channel breakdowns often mark the transition from an uptrend into a corrective phase, especially when accompanied by the loss of key moving averages.
What stands out?
✅ Breakdown below the rising channel.
✅ Price has also slipped below the 20 EMA and 50 EMA, with the 200 EMA acting as overhead resistance near $30.
✅ The former support around $30 has now turned into a major resistance zone.
✅ Unless buyers quickly reclaim this level, the path of least resistance remains lower.
Bearish Scenario
The first area to watch is around $22, where previous demand emerged.
However, there is another technical factor worth monitoring...
A large unfilled gap remains between roughly $17–18. Markets don't always fill gaps, but they frequently act as price magnets during corrective phases. If selling pressure accelerates, this zone could become the next major destination.
An eventual test of $15–16 cannot be ruled out if the broader downtrend continues.
What Would Change the Picture?
The bearish thesis weakens only if HIMS can reclaim $30 on a daily closing basis, turning the former support back into support once again. Until then, rallies may simply be relief bounces within a larger correction.
Every chart tells a story.
This one appears to be shifting from trend continuation to trend exhaustion. The rising channel has broken, key support has failed, and now the market will decide whether this is just a pullback—or the beginning of a deeper correction.
That trend may now be changing.
Price has broken below the channel support, signaling that bullish momentum is fading and the market structure is weakening. Channel breakdowns often mark the transition from an uptrend into a corrective phase, especially when accompanied by the loss of key moving averages.
What stands out?
✅ Breakdown below the rising channel.
✅ Price has also slipped below the 20 EMA and 50 EMA, with the 200 EMA acting as overhead resistance near $30.
✅ The former support around $30 has now turned into a major resistance zone.
✅ Unless buyers quickly reclaim this level, the path of least resistance remains lower.
Bearish Scenario
The first area to watch is around $22, where previous demand emerged.
However, there is another technical factor worth monitoring...
A large unfilled gap remains between roughly $17–18. Markets don't always fill gaps, but they frequently act as price magnets during corrective phases. If selling pressure accelerates, this zone could become the next major destination.
An eventual test of $15–16 cannot be ruled out if the broader downtrend continues.
What Would Change the Picture?
The bearish thesis weakens only if HIMS can reclaim $30 on a daily closing basis, turning the former support back into support once again. Until then, rallies may simply be relief bounces within a larger correction.
Every chart tells a story.
This one appears to be shifting from trend continuation to trend exhaustion. The rising channel has broken, key support has failed, and now the market will decide whether this is just a pullback—or the beginning of a deeper correction.
交易結束:達到停損點
this was a trap, will have to close the short. 
📊 Charts → 🏗️ Structure → 🎯 Probability =📖 Chart Story
⏳ Patience → 🚀Success
🎯 If this setup makes sense to you, show it some support with a Boost.
⏳ Patience → 🚀Success
🎯 If this setup makes sense to you, show it some support with a Boost.
免責聲明
這些資訊和出版物並非旨在提供,也不構成TradingView提供或認可的任何形式的財務、投資、交易或其他類型的建議或推薦。請閱讀使用條款以了解更多資訊。
📊 Charts → 🏗️ Structure → 🎯 Probability =📖 Chart Story
⏳ Patience → 🚀Success
🎯 If this setup makes sense to you, show it some support with a Boost.
⏳ Patience → 🚀Success
🎯 If this setup makes sense to you, show it some support with a Boost.
免責聲明
這些資訊和出版物並非旨在提供,也不構成TradingView提供或認可的任何形式的財務、投資、交易或其他類型的建議或推薦。請閱讀使用條款以了解更多資訊。