
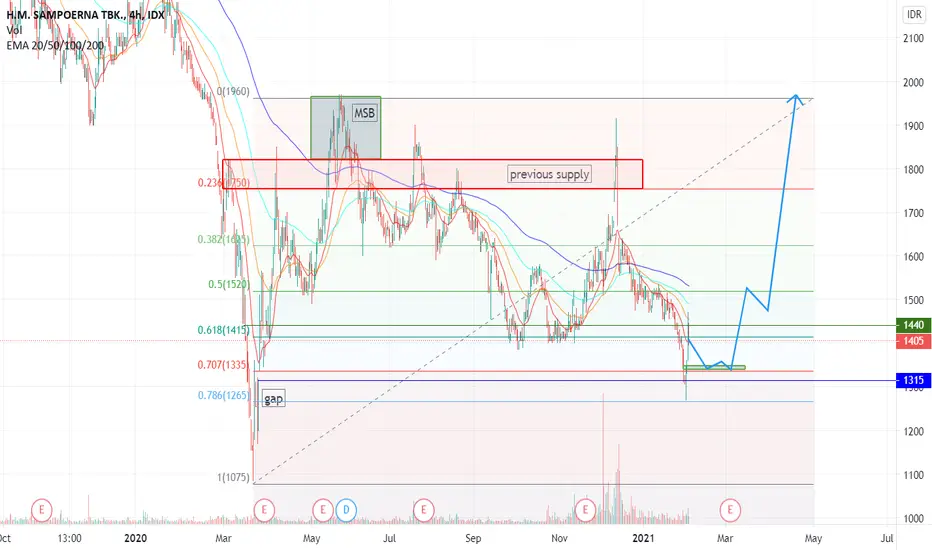
The retracement of IDX gives us second opportunity to grab HMSP.
Shown here is a 4 hour timeframe analysis
Several data to support this analysis (based on multiple timeframe)
1. The downside to the level of 1270 close the previous gap seen in 1 Hour TF and now closed.
2. Market structure breaking previous supply zone seen in 4 hr tf and 1d TF happened in May 2020 and now requires a retracement
3. Detecting the level of retracement, I drew fibonacci and found the fibo 0.786 match with 1270.
Having tapped 1270, we could see a major buying power into the stock.
Conclusion
- Set a buy order at the level 1350 as this represents a healthy pullback to a formed breaker
- slowly buying, to wait for the movement that is upside
PUMP IT!
Disc On
Shown here is a 4 hour timeframe analysis
Several data to support this analysis (based on multiple timeframe)
1. The downside to the level of 1270 close the previous gap seen in 1 Hour TF and now closed.
2. Market structure breaking previous supply zone seen in 4 hr tf and 1d TF happened in May 2020 and now requires a retracement
3. Detecting the level of retracement, I drew fibonacci and found the fibo 0.786 match with 1270.
Having tapped 1270, we could see a major buying power into the stock.
Conclusion
- Set a buy order at the level 1350 as this represents a healthy pullback to a formed breaker
- slowly buying, to wait for the movement that is upside
PUMP IT!
Disc On
註釋
Get along the train before its too late註釋
nice bounce on 1300, as predicted
免責聲明
這些資訊和出版物並非旨在提供,也不構成TradingView提供或認可的任何形式的財務、投資、交易或其他類型的建議或推薦。請閱讀使用條款以了解更多資訊。
免責聲明
這些資訊和出版物並非旨在提供,也不構成TradingView提供或認可的任何形式的財務、投資、交易或其他類型的建議或推薦。請閱讀使用條款以了解更多資訊。