
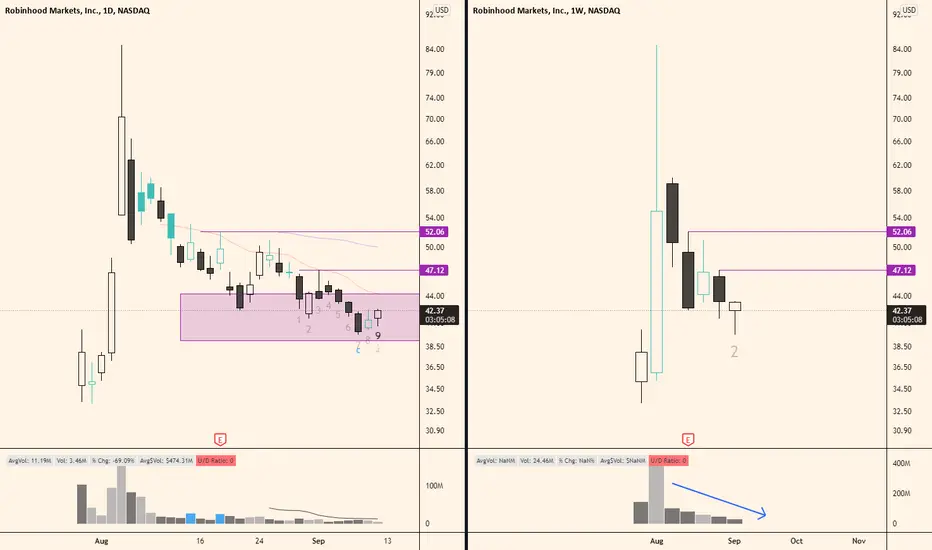
Robinhood made its first daily 9. Weekly chart might print the first bull candle week since the pullback. If daily doesn't form a good base next week we might be looking at either 13 combo or sequential.
An explosion on the daily volume bar over 20 day average could signify a bottoming entry.
An explosion on the daily volume bar over 20 day average could signify a bottoming entry.

Kidze
免責聲明
這些資訊和出版物並非旨在提供,也不構成TradingView提供或認可的任何形式的財務、投資、交易或其他類型的建議或推薦。請閱讀使用條款以了解更多資訊。