
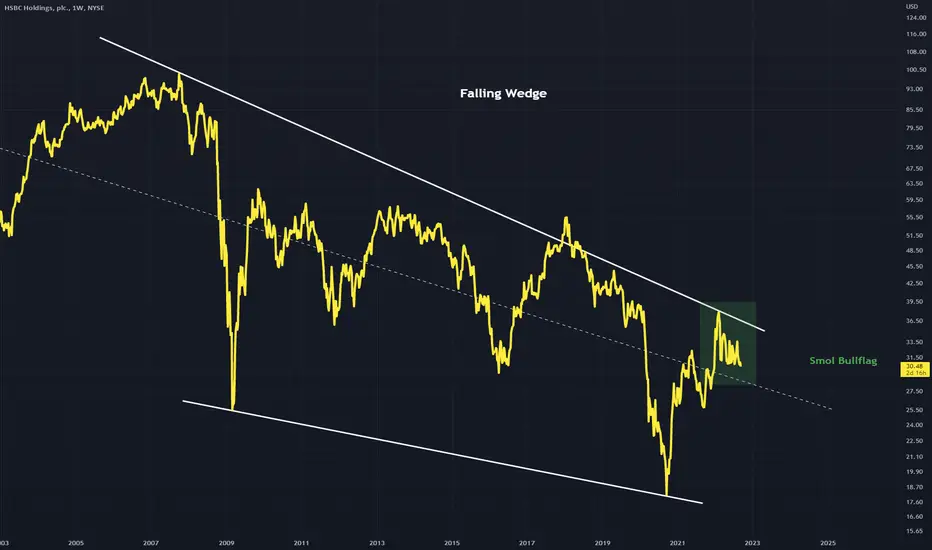
Falling Wedge structure using the peaks and troughs of price
The middle dashed line is the strongest trend line (down)
A small bullflag can also be seen forming at the bottom of this falling wedge
Will a trend change be the result?
Weekly timeframe
The middle dashed line is the strongest trend line (down)
A small bullflag can also be seen forming at the bottom of this falling wedge
Will a trend change be the result?
Weekly timeframe

免責聲明
這些資訊和出版物並非旨在提供,也不構成TradingView提供或認可的任何形式的財務、投資、交易或其他類型的建議或推薦。請閱讀使用條款以了解更多資訊。