
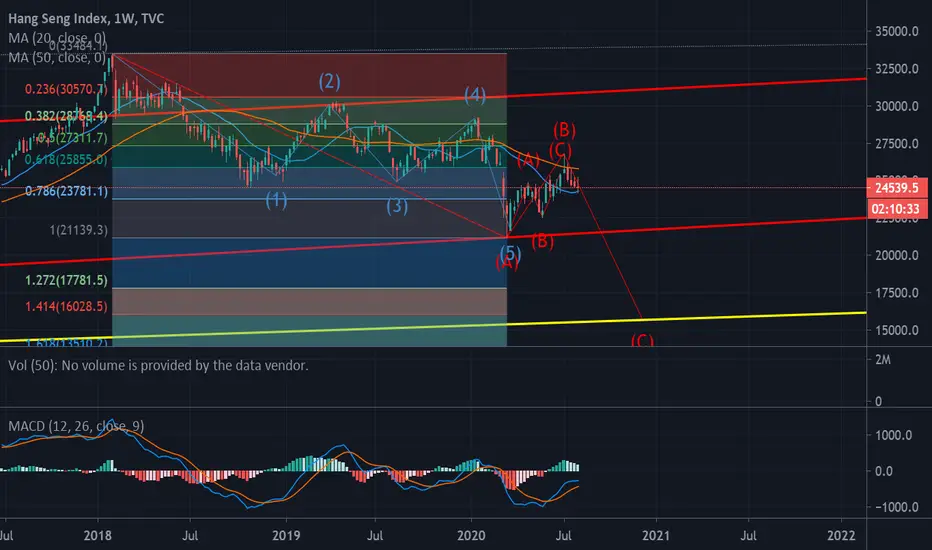
This is a prediction of HSI trend since 2018 using Wave Theory.
It was a complicated A wave with 5 waves inside caused almost 2 years.
A1 - Oct 2018
A2 - Apr 2019
A3 - Jul 2019
A4 - Jan 2020
A5 - Mar 2020 (the global pandemic concern)
Rebound from A5, It completed a B wave in 4 months.
BA - Apr 2020
BB - May 2020
BC - Jul 2020
Rapid rebound and completion of B wave, strong and quick correction C wave could be expected.
Personally it could be seen in Q4 2020.
Critical Level:
1st target: ~21139
2nd target: ~16800 - 17000
Last target: ~13300
It was a complicated A wave with 5 waves inside caused almost 2 years.
A1 - Oct 2018
A2 - Apr 2019
A3 - Jul 2019
A4 - Jan 2020
A5 - Mar 2020 (the global pandemic concern)
Rebound from A5, It completed a B wave in 4 months.
BA - Apr 2020
BB - May 2020
BC - Jul 2020
Rapid rebound and completion of B wave, strong and quick correction C wave could be expected.
Personally it could be seen in Q4 2020.
Critical Level:
1st target: ~21139
2nd target: ~16800 - 17000
Last target: ~13300

免責聲明
這些資訊和出版物並非旨在提供,也不構成TradingView提供或認可的任何形式的財務、投資、交易或其他類型的建議或推薦。請閱讀使用條款以了解更多資訊。