
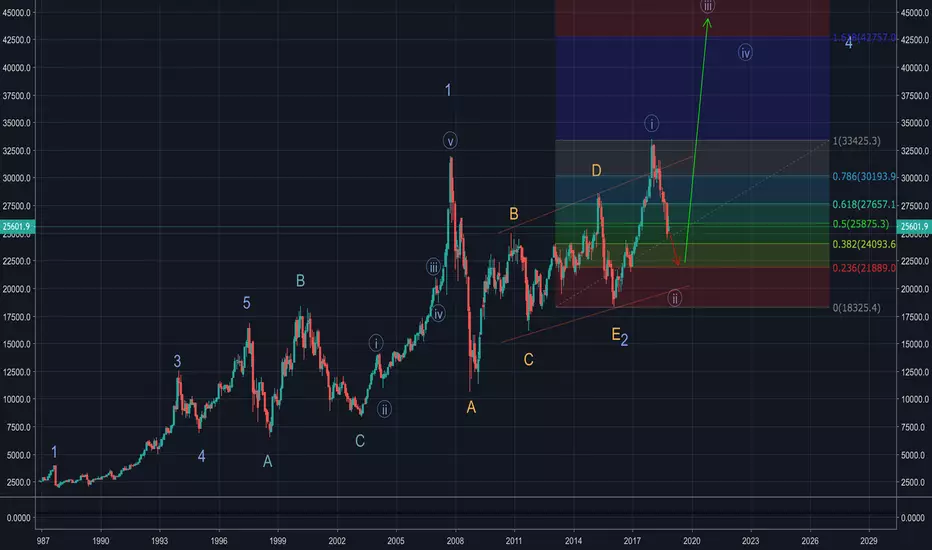
Unfortunately not enough data. Graph shows values from 1987.
We proceeded from the value of 100 points in 1964 as the beginning of the first wave.
Probability that the correction comes to an end, but the goal in 24093 should be achieved in any case.
If the index goes below this value - the next target is 21889 points. This is the most negative scenario. In this case there is an extremely high probability of forming a triangle and the correction will be very long.
Upon completion of the correction target 42757
We proceeded from the value of 100 points in 1964 as the beginning of the first wave.
Probability that the correction comes to an end, but the goal in 24093 should be achieved in any case.
If the index goes below this value - the next target is 21889 points. This is the most negative scenario. In this case there is an extremely high probability of forming a triangle and the correction will be very long.
Upon completion of the correction target 42757

免責聲明
這些資訊和出版物並非旨在提供,也不構成TradingView提供或認可的任何形式的財務、投資、交易或其他類型的建議或推薦。請閱讀使用條款以了解更多資訊。
免責聲明
這些資訊和出版物並非旨在提供,也不構成TradingView提供或認可的任何形式的財務、投資、交易或其他類型的建議或推薦。請閱讀使用條款以了解更多資訊。