
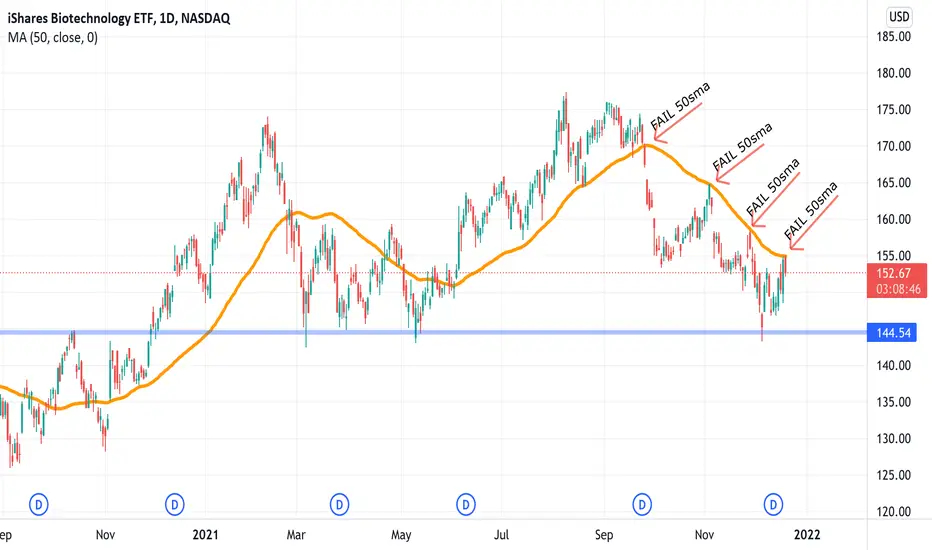
50sma has been an important moving average for this ETF.
We see 3 consecutive tests of the 50sma as resistance and a bounce lower.
As we see lower highs and lower lows, the bearish trend is confirmed.
I expect we fail again and test the blue line ($144.5).
We see 3 consecutive tests of the 50sma as resistance and a bounce lower.
As we see lower highs and lower lows, the bearish trend is confirmed.
I expect we fail again and test the blue line ($144.5).
註釋
Another opportunity to short is presenting if we can't get above the $144.5 blue line again.If we test it and head lower, the next target is $130
交易結束:目標達成

免責聲明
這些資訊和出版物並非旨在提供,也不構成TradingView提供或認可的任何形式的財務、投資、交易或其他類型的建議或推薦。請閱讀使用條款以了解更多資訊。
免責聲明
這些資訊和出版物並非旨在提供,也不構成TradingView提供或認可的任何形式的財務、投資、交易或其他類型的建議或推薦。請閱讀使用條款以了解更多資訊。