
hey guys ,
waiting from a long time to publish this idea
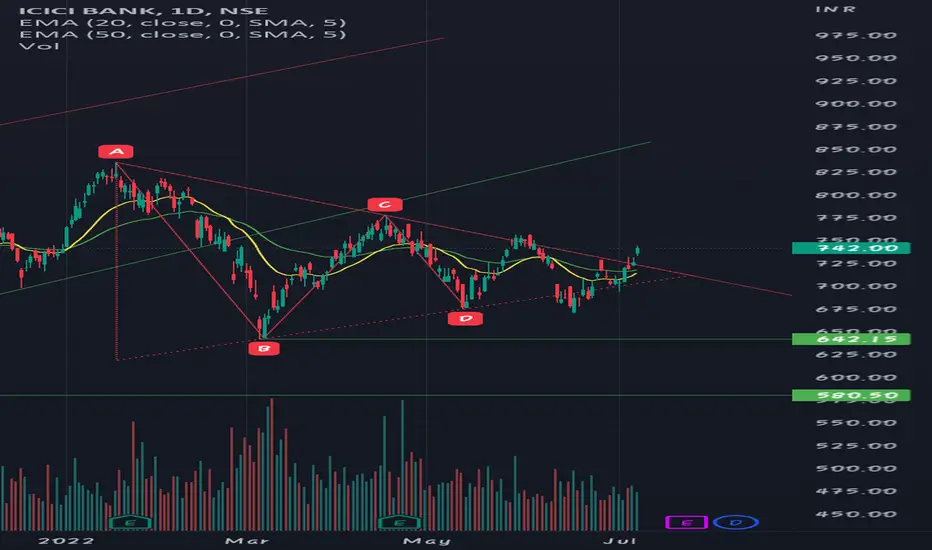
icici is presenting a beautiful bullish chart
from a short period of time
this stock was moving in TRIANGLE PATTERN ,
between this pattern
this stock tried to go bearish but it recovered
and it resulted to bear trap of traders
now we can see that a beautiful long green candle is presented above the resistance area ,
this gives us a confidence to buy this stock and earn high returns ,
also this stock is fundamentally good
therefore, you can buy this stock and achieve high returns
THE CHART IS SO BEAUTIFUL THAT
YOU CAN UNDERSTAND IT IN FORST VIEW ,
AND PLS GUYS IF U LIKED MY ANALYSIS
COMMENT , LIKE AND FOLLOW
😀😀
waiting from a long time to publish this idea
icici is presenting a beautiful bullish chart
from a short period of time
this stock was moving in TRIANGLE PATTERN ,
between this pattern
this stock tried to go bearish but it recovered
and it resulted to bear trap of traders
now we can see that a beautiful long green candle is presented above the resistance area ,
this gives us a confidence to buy this stock and earn high returns ,
also this stock is fundamentally good
therefore, you can buy this stock and achieve high returns
THE CHART IS SO BEAUTIFUL THAT
YOU CAN UNDERSTAND IT IN FORST VIEW ,
AND PLS GUYS IF U LIKED MY ANALYSIS
COMMENT , LIKE AND FOLLOW
😀😀

免責聲明
這些資訊和出版物並非旨在提供,也不構成TradingView提供或認可的任何形式的財務、投資、交易或其他類型的建議或推薦。請閱讀使用條款以了解更多資訊。
免責聲明
這些資訊和出版物並非旨在提供,也不構成TradingView提供或認可的任何形式的財務、投資、交易或其他類型的建議或推薦。請閱讀使用條款以了解更多資訊。