
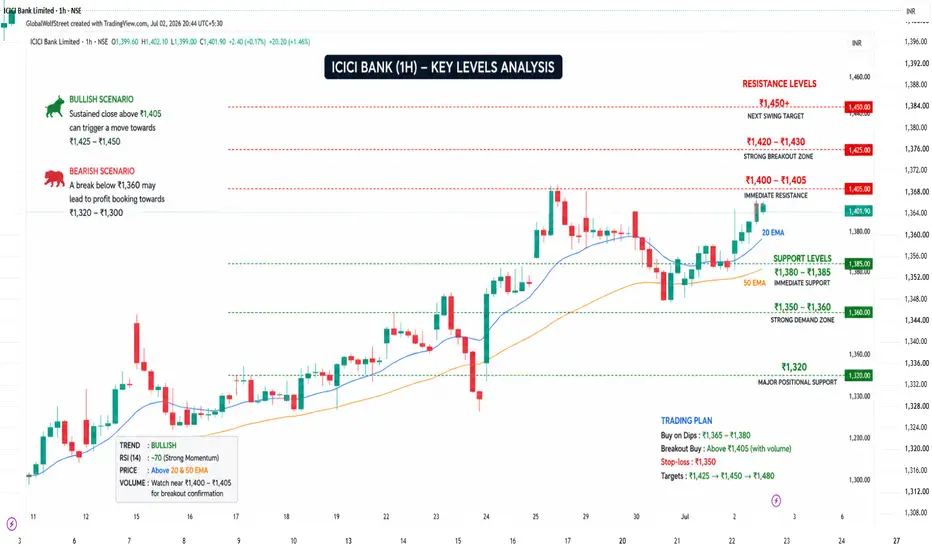
Key Levels
Resistance
₹1,400–1,405 – Immediate resistance
₹1,420–1,430 – Strong breakout zone
₹1,450+ – Next swing target if breakout sustains
Support
₹1,380–1,385 – Immediate support
₹1,350–1,360 – Strong demand zone
₹1,320 – Major positional support
Trading View
🟢 Bullish Scenario
Sustained close above ₹1,405 can trigger a move towards ₹1,425–1,450.
Trend remains positive while the stock trades above ₹1,360.
🔴 Bearish Scenario
A break below ₹1,360 may lead to profit booking towards ₹1,320–1,300.
Swing Trading Plan
Buy on dips: ₹1,365–1,380
Breakout buy: Above ₹1,405 with strong volume
Stop-loss: ₹1,350 (or according to your risk management)
Targets: ₹1,425 → ₹1,450 → ₹1,480
Technical Indicators
✅ Trend: Bullish
✅ RSI: Around 70 (strong momentum but near overbought)
✅ Price is above key moving averages
⚠️ Watch volume closely near ₹1,400–1,405 for confirmation of a breakout.

相關出版品
免責聲明
這些資訊和出版物並非旨在提供,也不構成TradingView提供或認可的任何形式的財務、投資、交易或其他類型的建議或推薦。請閱讀使用條款以了解更多資訊。