搜尋
產品
社群
市場
經紀商
更多
TW
立即開始
做空
已更新
2018年5月20日
ICON
3
取得這個圖表
1
520
2018年5月19日
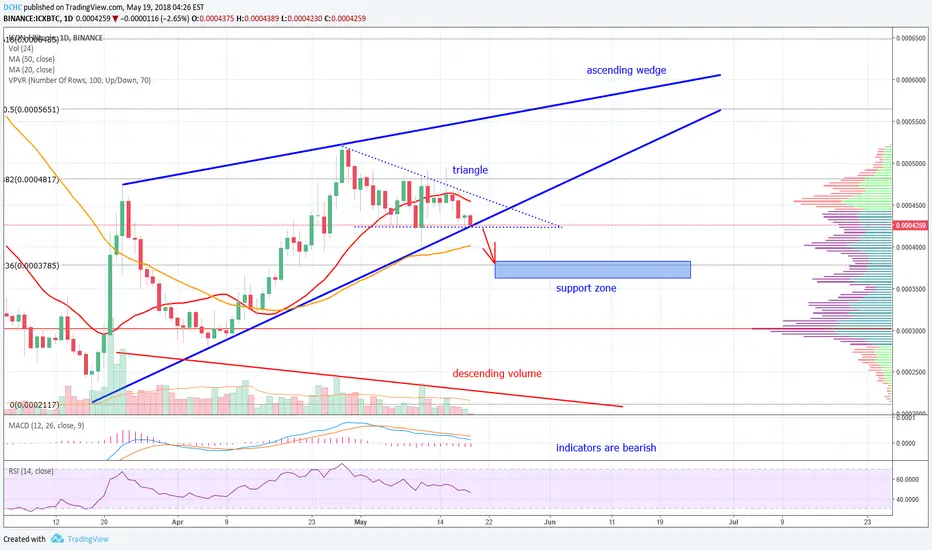
Hi my friends, here is ICX chart.
Majkee
2018年5月20日
註釋
candle close under the blue trend line and we are still inside the dotted small triangle, way to support zone is still open
2018年5月21日
註釋
Akcier
關注
正在關注
此外:
Chart Patterns
Technical Indicators
Trend Analysis
相關出版品
BitShares cup and handle
由Akcier提供
STRATIS -triangle + cup and handle pattern?
由Akcier提供
WAVES - bullish wedge + divergence
由Akcier提供
STEEM - buying prediction
由Akcier提供
Cardano
由Akcier提供
NEO
由Akcier提供
Stellar - head and shoulder
由Akcier提供
VeChain
由Akcier提供
PIVX
由Akcier提供
SUBSTRATUM
由Akcier提供
ETHEREUM
由Akcier提供
Bitcoin - reversal head and shoulders + waves
由Akcier提供
免責聲明
這些資訊和出版物並非旨在提供,也不構成TradingView提供或認可的任何形式的財務、投資、交易或其他類型的建議或推薦。請閱讀
使用條款
以了解更多資訊。
Chart Patterns
Technical Indicators
Trend Analysis
Akcier
關注
正在關注
此外:
相關出版品
BitShares cup and handle
由Akcier提供
STRATIS -triangle + cup and handle pattern?
由Akcier提供
WAVES - bullish wedge + divergence
由Akcier提供
STEEM - buying prediction
由Akcier提供
Cardano
由Akcier提供
NEO
由Akcier提供
Stellar - head and shoulder
由Akcier提供
VeChain
由Akcier提供
PIVX
由Akcier提供
SUBSTRATUM
由Akcier提供
ETHEREUM
由Akcier提供
Bitcoin - reversal head and shoulders + waves
由Akcier提供
免責聲明
這些資訊和出版物並非旨在提供,也不構成TradingView提供或認可的任何形式的財務、投資、交易或其他類型的建議或推薦。請閱讀
使用條款
以了解更多資訊。