做多
Update: Falling Wedge
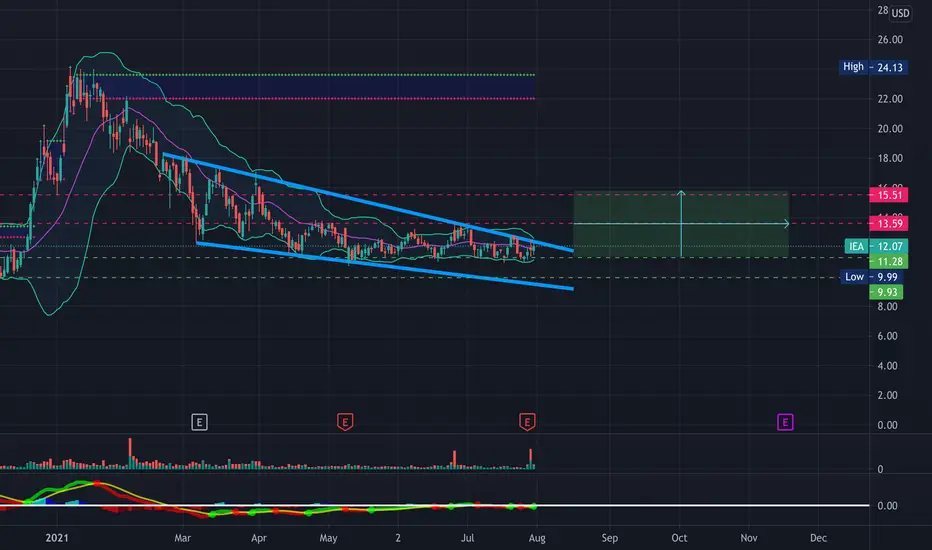
IEA is nearing the end of the symmetrical triangle previously charted. While still holding that formation is also forming what appears to be a falling wedge (bullish). Bollinger bands are squeezing along with a MACD cross to close on Friday. Just some support and resistance levels to watch, see previous chart & description for price targets. Bullish will be looking for a breakout-
--------------------
IEA has been consolidating in this triangle for quite some time now. Undoubtedly a long-term play has held its support and looks to have found a bottom, with volume should really pop
- Hidden bullish divergence on the RSI
- Bollinger Bands squeezing indicating a big move
- Buyer volume starting to pick up again
- Held support at the $11.28 level, has resistance circa $13.59 and $15.51
PT1- $13.65
PT2- $14.80
PT3- $15.75
註釋
Price Target 1 reached ✅
免責聲明
這些資訊和出版物並非旨在提供,也不構成TradingView提供或認可的任何形式的財務、投資、交易或其他類型的建議或推薦。請閱讀使用條款以了解更多資訊。
免責聲明
這些資訊和出版物並非旨在提供,也不構成TradingView提供或認可的任何形式的財務、投資、交易或其他類型的建議或推薦。請閱讀使用條款以了解更多資訊。