
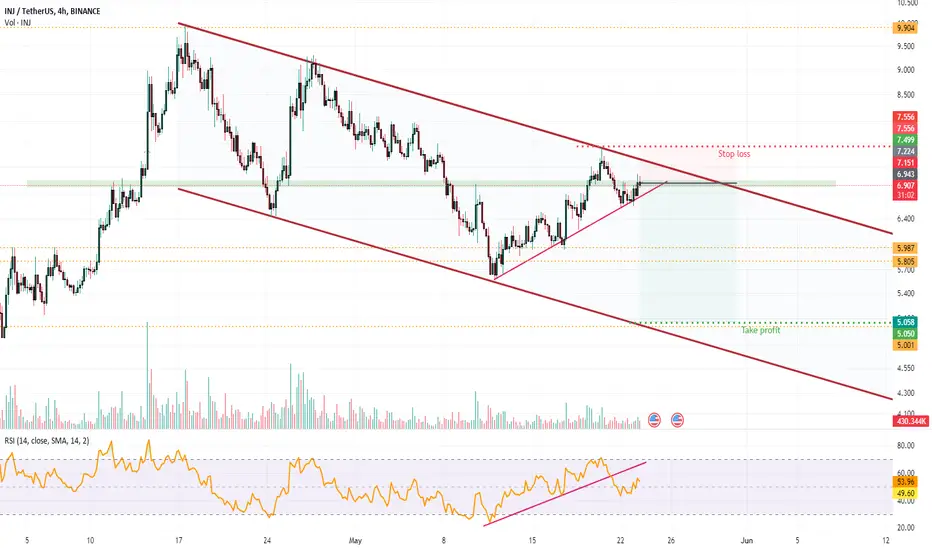
This is what i see in the inj/usdt chart
Nevertheless we need to see:
A lower high;
A trend line break confirmation.
To give more momentum to this trade.
RSI already broke the trend wich is a bullish sign for our analisys.
If the price break up and take my stop loss I assume the loss and move to the next trade.
Expected trade time: 10 to 15 days
Risk/Reward ratio - 1:3
Capital exposure: 125

免責聲明
這些資訊和出版物並非旨在提供,也不構成TradingView提供或認可的任何形式的財務、投資、交易或其他類型的建議或推薦。請閱讀使用條款以了解更多資訊。
免責聲明
這些資訊和出版物並非旨在提供,也不構成TradingView提供或認可的任何形式的財務、投資、交易或其他類型的建議或推薦。請閱讀使用條款以了解更多資訊。