
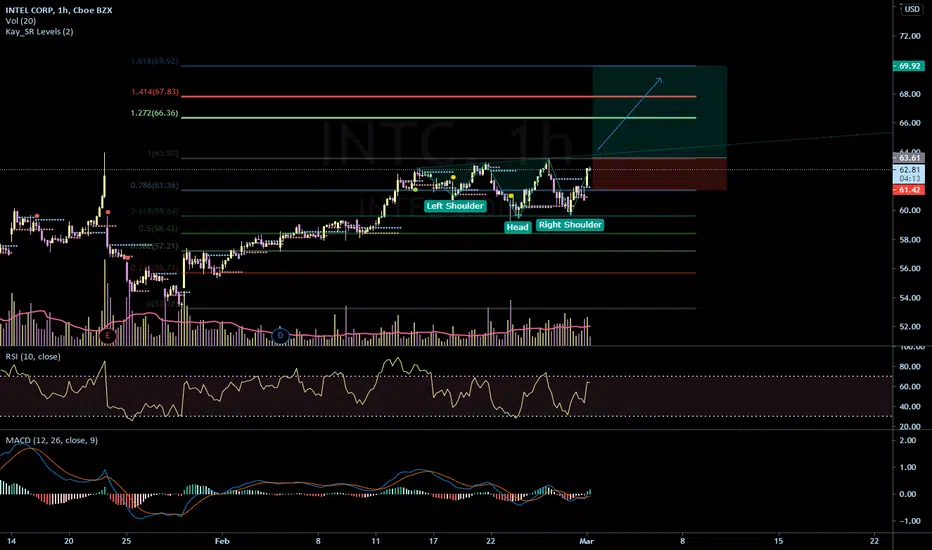
On the 1h chart INTC can be seen forming an inverse Head and Shoulders Pattern, or even a Double Bottom pattern. This is a very bullish sign, with the MACD transitioning into the green. If Intel successfully breaks the 63.57 line, it could go long having price targets of:
$66.30 - $67.80 - $70.00
In my opinion this looks like a very safe bull play on INTC. Always remember to buy the dip, thanks for viewing!
$66.30 - $67.80 - $70.00
In my opinion this looks like a very safe bull play on INTC. Always remember to buy the dip, thanks for viewing!

免責聲明
這些資訊和出版物並非旨在提供,也不構成TradingView提供或認可的任何形式的財務、投資、交易或其他類型的建議或推薦。請閱讀使用條款以了解更多資訊。