
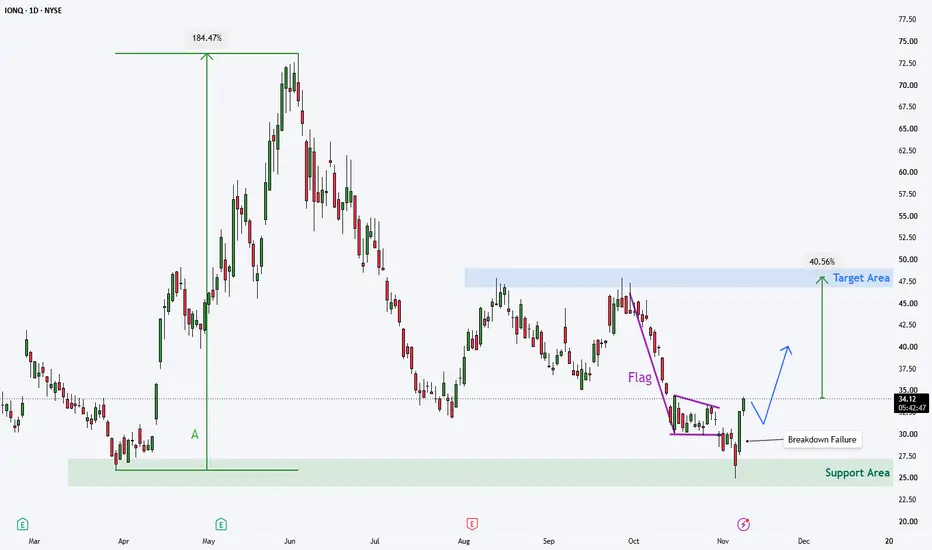
IONQ – Potential Bounce From Support
The last time the stock traded around the $26 level, it went on to deliver a 184% rally (A). Since then, the price has not revisited this level, suggesting that it could now act as support.
Looking at the chart, we can see that the price broke down from a Flag formation but made very little downside progress before reversing back to the upside. This potentially created a Breakdown Failure setup.
We therefore have several bullish factors coming together:
- A well-established support area around $26.
- A potential Breakdown Failure following the Flag breakdown.
- A relatively large green candle showing a strong buying response to the decline.
Taking all these factors into account, I believe the stock could easily move higher toward the $48 level, representing approximately 41% upside from the current price.

免責聲明
這些資訊和出版物並非旨在提供,也不構成TradingView提供或認可的任何形式的財務、投資、交易或其他類型的建議或推薦。請閱讀使用條款以了解更多資訊。