
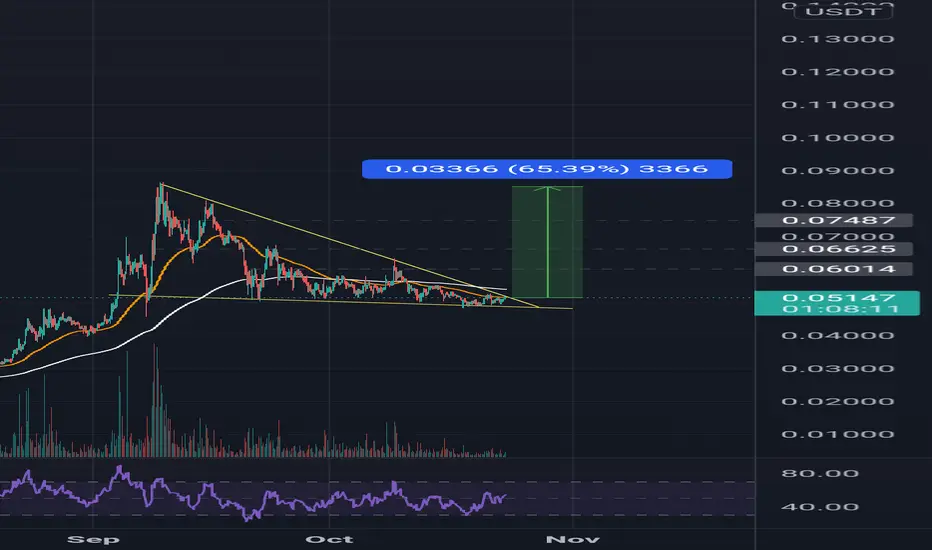
The chart is showing a falling wedge, which is a bullish pattern.We will see a a breakout in upcoming days.
If it manage to break the resistant trendline ,We will see the marked target soon.
0.13$ (1.618 FIB) is the realistic target.
Happy trading 💥
- Showing a bullish momentum
- The price is above SMA which is bullish
- MACD is showing a possible bullish momentum
- RSI is neutral ; More rooms to grow
- currently sittingon 0.5FIB
If it manage to break the resistant trendline ,We will see the marked target soon.
0.13$ (1.618 FIB) is the realistic target.
Happy trading 💥

免責聲明
這些資訊和出版物並非旨在提供,也不構成TradingView提供或認可的任何形式的財務、投資、交易或其他類型的建議或推薦。請閱讀使用條款以了解更多資訊。
免責聲明
這些資訊和出版物並非旨在提供,也不構成TradingView提供或認可的任何形式的財務、投資、交易或其他類型的建議或推薦。請閱讀使用條款以了解更多資訊。