
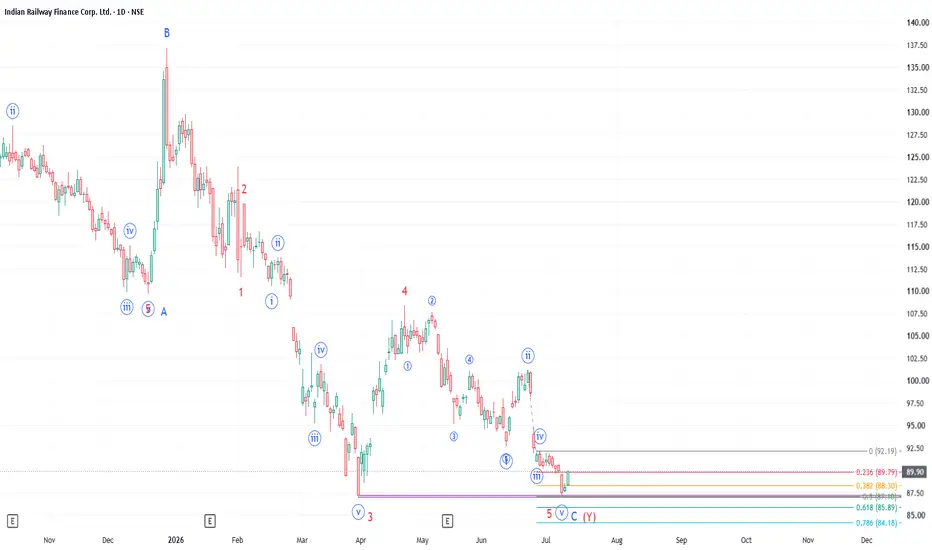
IRFC has been undergoing a very long correction since 15 July 2024. (i.e. correction for last 2 years) after completion of its first Primary Degree Impulse wave formation.
The correction is a double zigzag, i.e. WXY pattern. Zigzag, one of the three primary corrective structures with a 5-3-5 sequence results in deep correction. When one zigzag (Wave W) could not achieve the required correction, another zigzag (Wave Y) gets formed after a brief counter wave formation (Wave X).
In the last two years, the stock had completed Wave W, Wave X, Wave A and Wave B of second zigzag (Wave Y). Wave B of Wave Y got completed on 29 Dec 2025 as given in the chart. Stock has already corrected more than 61.8%.
Wave C has been in progress. Wave 3 of said Wave C got completed on 30 Mar 2026 (price of 87.00). It is highly likely that stock has completed Wave 5 of said Wave C at similar price levels on 8 July or could be completing by retesting same levels (as given in the chart).
One may consider going long on the stock with a stop loss of 85.25 or wait for confirmation of new impulse formation and enter.

ChartTheWave |
t.me/chartthewave
This channel is a common forum for "Elliott Wave Principle" enthusiasts, learners and practitioners. We aim to build a team of traders who practice EWP for common benefit; co-learn, teach, share, validate and benefit.
t.me/chartthewave
This channel is a common forum for "Elliott Wave Principle" enthusiasts, learners and practitioners. We aim to build a team of traders who practice EWP for common benefit; co-learn, teach, share, validate and benefit.
免責聲明
這些資訊和出版物並非旨在提供,也不構成TradingView提供或認可的任何形式的財務、投資、交易或其他類型的建議或推薦。請閱讀使用條款以了解更多資訊。
ChartTheWave |
t.me/chartthewave
This channel is a common forum for "Elliott Wave Principle" enthusiasts, learners and practitioners. We aim to build a team of traders who practice EWP for common benefit; co-learn, teach, share, validate and benefit.
t.me/chartthewave
This channel is a common forum for "Elliott Wave Principle" enthusiasts, learners and practitioners. We aim to build a team of traders who practice EWP for common benefit; co-learn, teach, share, validate and benefit.
免責聲明
這些資訊和出版物並非旨在提供,也不構成TradingView提供或認可的任何形式的財務、投資、交易或其他類型的建議或推薦。請閱讀使用條款以了解更多資訊。